


0
US Dollar Index
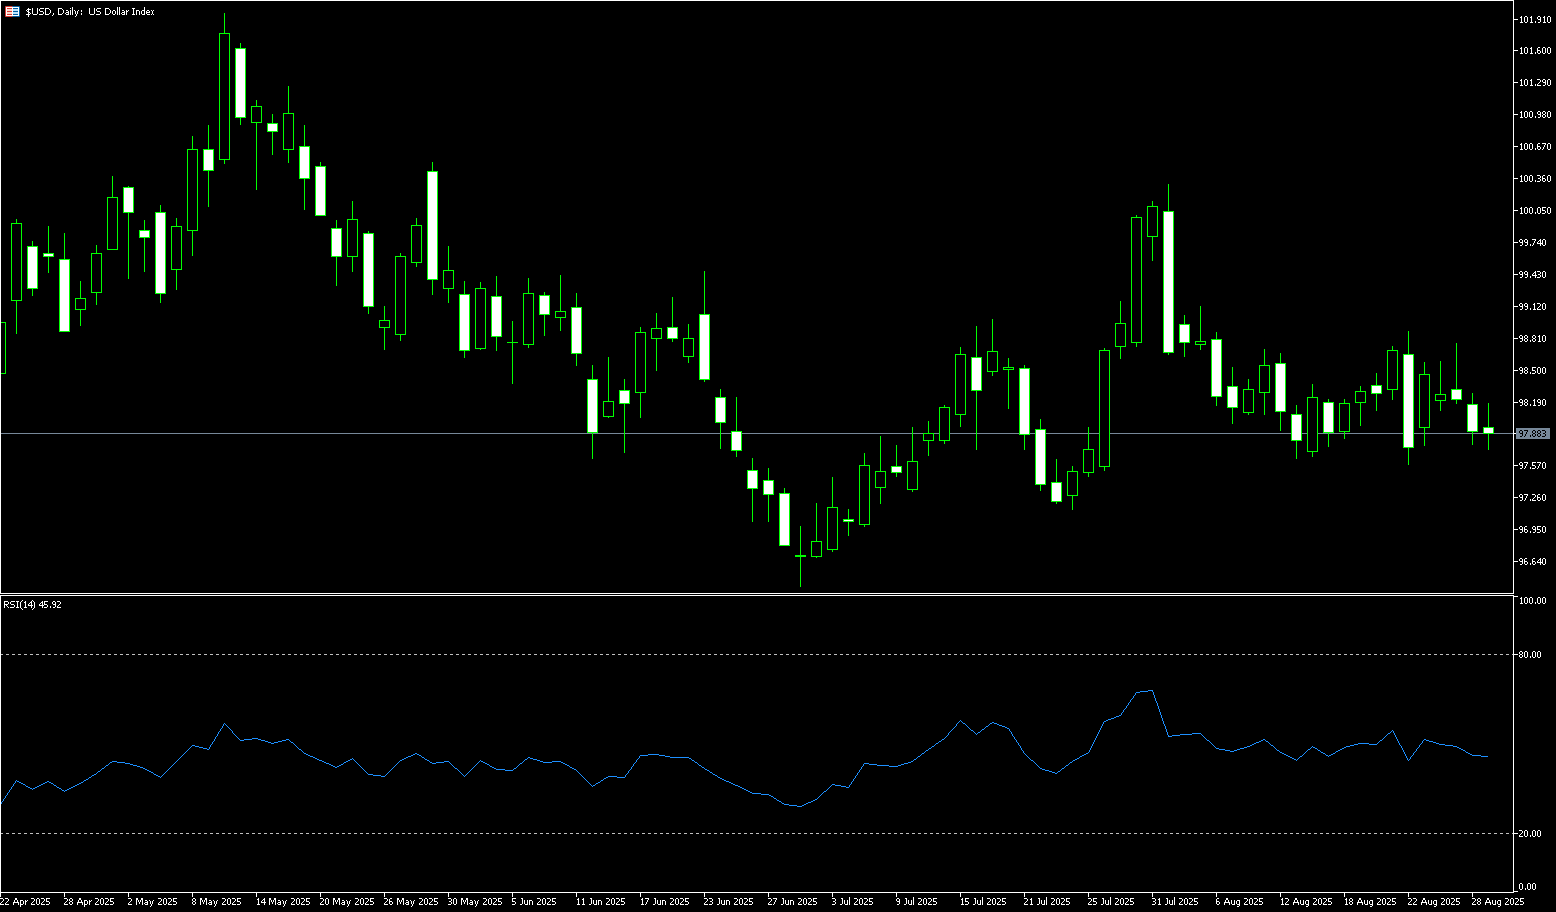
The US dollar index rose slightly last week but is currently trading below 98.00. Persistent price pressures highlight the challenges the Federal Reserve faces in cutting interest rates amid a weak job market. The core PCE price index rose 0.3% in July, bringing its year-over-year growth to 2.9%, the fastest pace since February. Consumer spending grew at its strongest pace in four months. Late Thursday, Federal Reserve Governor Waller expressed support for a September rate cut, with further cuts possible over the next three to six months if employment remains weak and inflation remains stable. The Fed has already held interest rates steady through 2025 due to tariff-driven inflation risks, but recent weak employment data and comments from Powell suggest a rate cut may be warranted. Despite recent gains, the dollar is heading towards the nearly 2% decline seen in August as markets price in an easing policy at the September 16-17 meeting.
The US dollar index continued its decline in late trading last week, trading as low as 97.69. Technical analysis on the daily chart shows that the US dollar index remains within a descending channel pattern, suggesting a persistent bearish bias. The 14-day Relative Strength Index (RSI) technical indicator is below the 50 level, indicating bearish market sentiment. Furthermore, short-term price momentum is weakening as the US dollar index has fallen below its 89-day simple moving average at 98.69. On the downside, immediate support lies at last week's low of 97.69, followed by the seven-week low of 97.11 recorded on July 24. Further declines would exert downward pressure on the US dollar index, potentially testing 96.38, the lowest point since February 2022, recorded on July 1, 2025. Currently, the US dollar index is testing immediate resistance at its 34-day simple moving average at 98.30, followed by the 89-day simple moving average at 98.69. A successful break above this overlapping resistance zone would establish a bullish bias and support the US dollar index's exploration of the round-figure mark of 99.00, as well as the 99.32 area (the August 11 high).
Consider shorting the US Dollar Index at 97.98 today, with a stop-loss at 98.10 and a target of 97.50 or 97.40.
WTI Spot Crude Oil
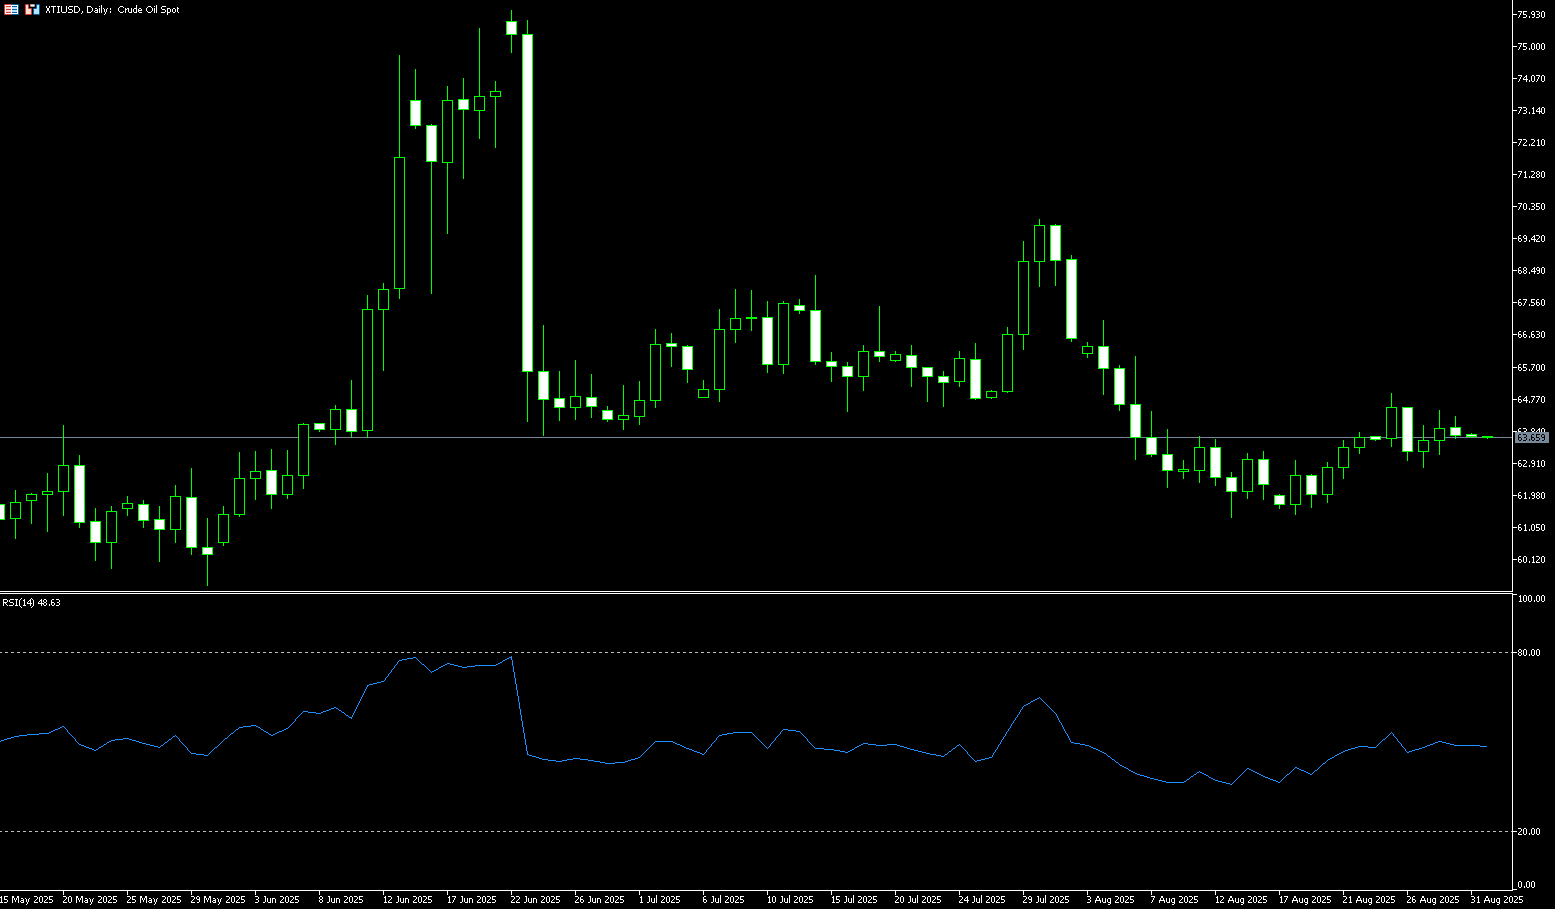
WTI crude oil fluctuated narrowly between $62.80 and $64.95 last week, driven by concerns about oversupply and US pressure on India to halt Russian oil imports. The US has raised tariffs on many Indian imports to 50%, with US President Trump following through on his threat to punish India for purchasing discounted Russian oil. This measure, which took effect on Wednesday, exacerbated supply concerns and put pressure on crude oil prices. Oil traders will be closely watching India's response to US pressure to halt Russian oil purchases. Meanwhile, Russia launched missile and drone attacks against two Russian refineries in Ukraine last week. Escalating tensions between Russia and Ukraine could drive WTI prices higher in the short term. Data released by the US Energy Information Administration (EIA) on Wednesday showed a larger-than-expected draw in crude oil inventories last week. Strong demand from the world's largest oil consumer is likely to support oil prices.
The daily chart shows that WTI crude oil prices failed to break through the $65.00 mark and the $65.76 resistance level (the 50.0% Fibonacci retracement level from $54.78 to $76.74). A new downtrend has begun, while the 14-day Relative Strength Index (RSI) is hovering around 49.50, indicating a lack of clear directional momentum. Once oil prices break below the 9-day simple moving average at $63.48, further declines are likely. The next target is $63.00 (the round-number mark). Continued downward testing of $61.45 (the low set on August 18) and the $60 psychological level, where support has repeatedly been found, will form a temporary bottom. Furthermore, if oil prices break above the $65.00 mark, a new leg of gains is in the offing, potentially encountering resistance near $65.76 (the 50.0% Fibonacci retracement of the $54.78 to $76.74 range). A break below this level would target the 200-day simple moving average at $67.07.
Consider going long on crude oil at $63.58 today. Stop-loss: $63.40. Target: $65.40, $65.60.
Spot Gold
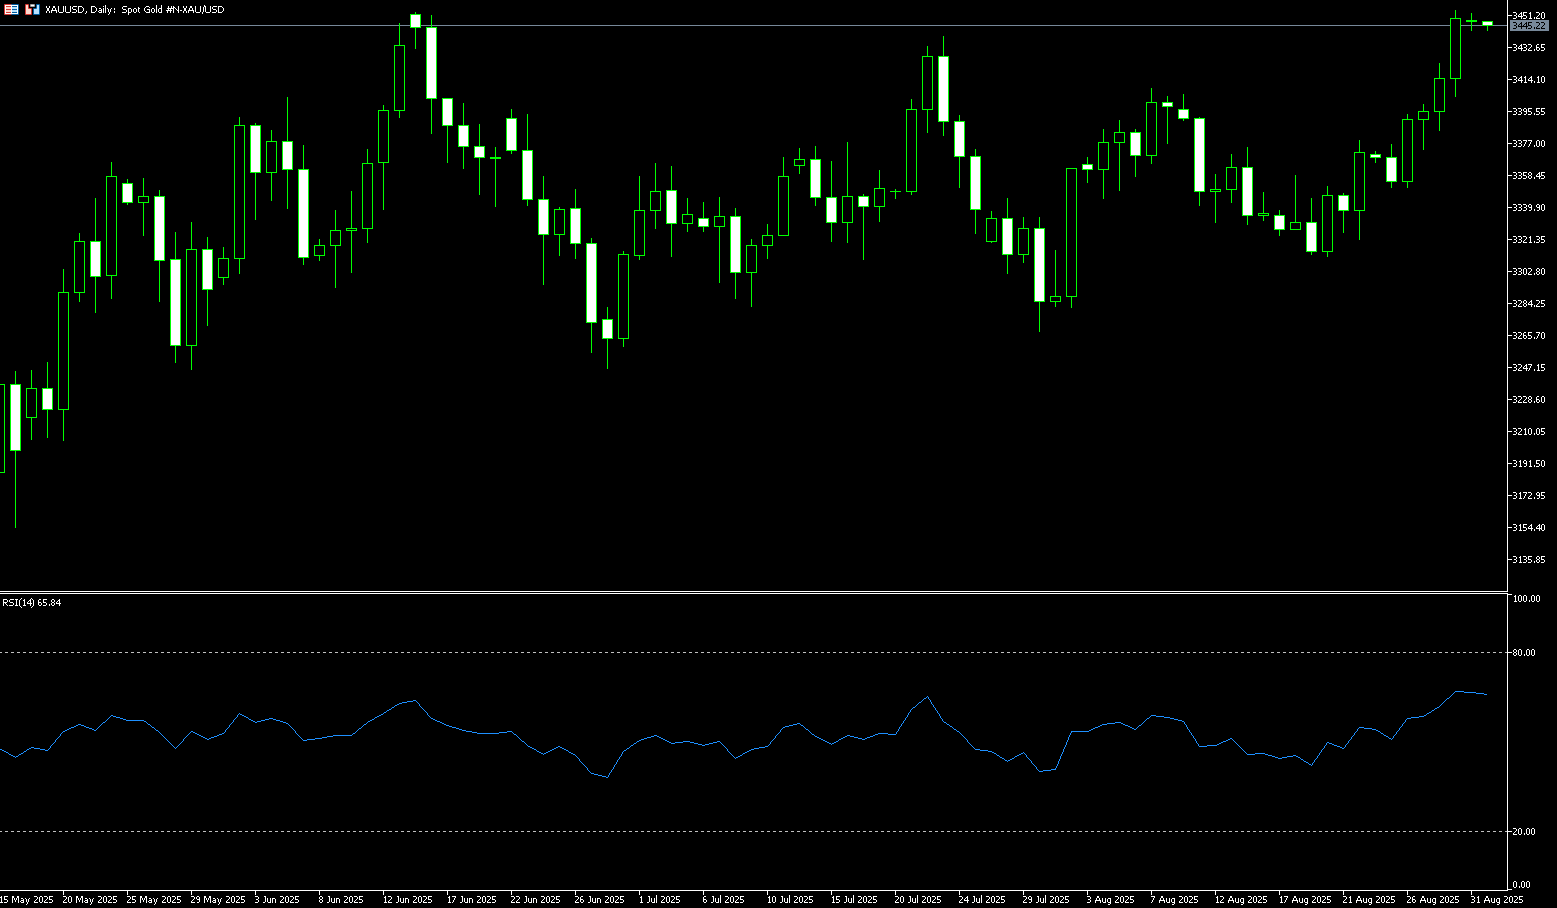
Gold broke through $3,400 per ounce last week, reaching a one-month high of $3,454, with the PCE report as the next catalyst. Gold is heading for its second consecutive weekly gain, supported by a weaker dollar and safe-haven demand. Amidst growing uncertainty about US monetary policy, investors continue to seek safe havens, providing continued support for the metal. Concerns that political pressure on the Federal Reserve could accelerate interest rate cuts are driving price increases, with a 25 basis point cut widely expected in September. Federal Reserve Governor Christopher Waller also expressed support for rate cuts starting next month, saying he "fully expects" further cuts to bring policy closer to neutral, in line with his colleagues. A weaker dollar makes dollar-denominated gold cheaper for overseas buyers, stimulating international demand. Meanwhile, New York Fed President John Williams's hints at a possible rate cut further reinforced market expectations of a weaker dollar. As the dollar loses its luster, gold, a traditional "safe haven," naturally becomes a target for investors. Gold rose approximately 4% in August, its best monthly performance since April.
From a technical perspective, gold's breakout above the key resistance level of $3,400 has opened up upside potential. The bullish outlook remains intact in the long term, with gold paring losses after finding support above the $3,400 mark and rebounding to around $3,454, its highest level in nearly two and a half months. Currently, the upper Bollinger Band level at $3,422.80 is acting as immediate support. Further support lies below at the $3,400 level and the 10-day simple moving average around $3,373. The 14-day Relative Strength Index (RSI) on the daily chart is approaching overbought territory (currently hovering around 65) and remains firmly in bullish territory, suggesting continued buying as long as $3,400 holds. On the upside, the rally extends to $3,454 (last week's high). A break above this level would raise the next target to the previous all-time high of $3,500. Further tests of $3,550 and a new all-time high of $3,600 are possible. Conversely, a break below $3,400 could expose gold to potential declines. Initial support lies at $3,373 (the 10-day simple moving average) and $3,371, the low of August 27. A close below this level could expose gold to $3,351, the August 26 low.
Consider a long position in gold at $3,443 today, with a stop-loss at $3,440 and a target of $3,470-3,475.
AUD/USD
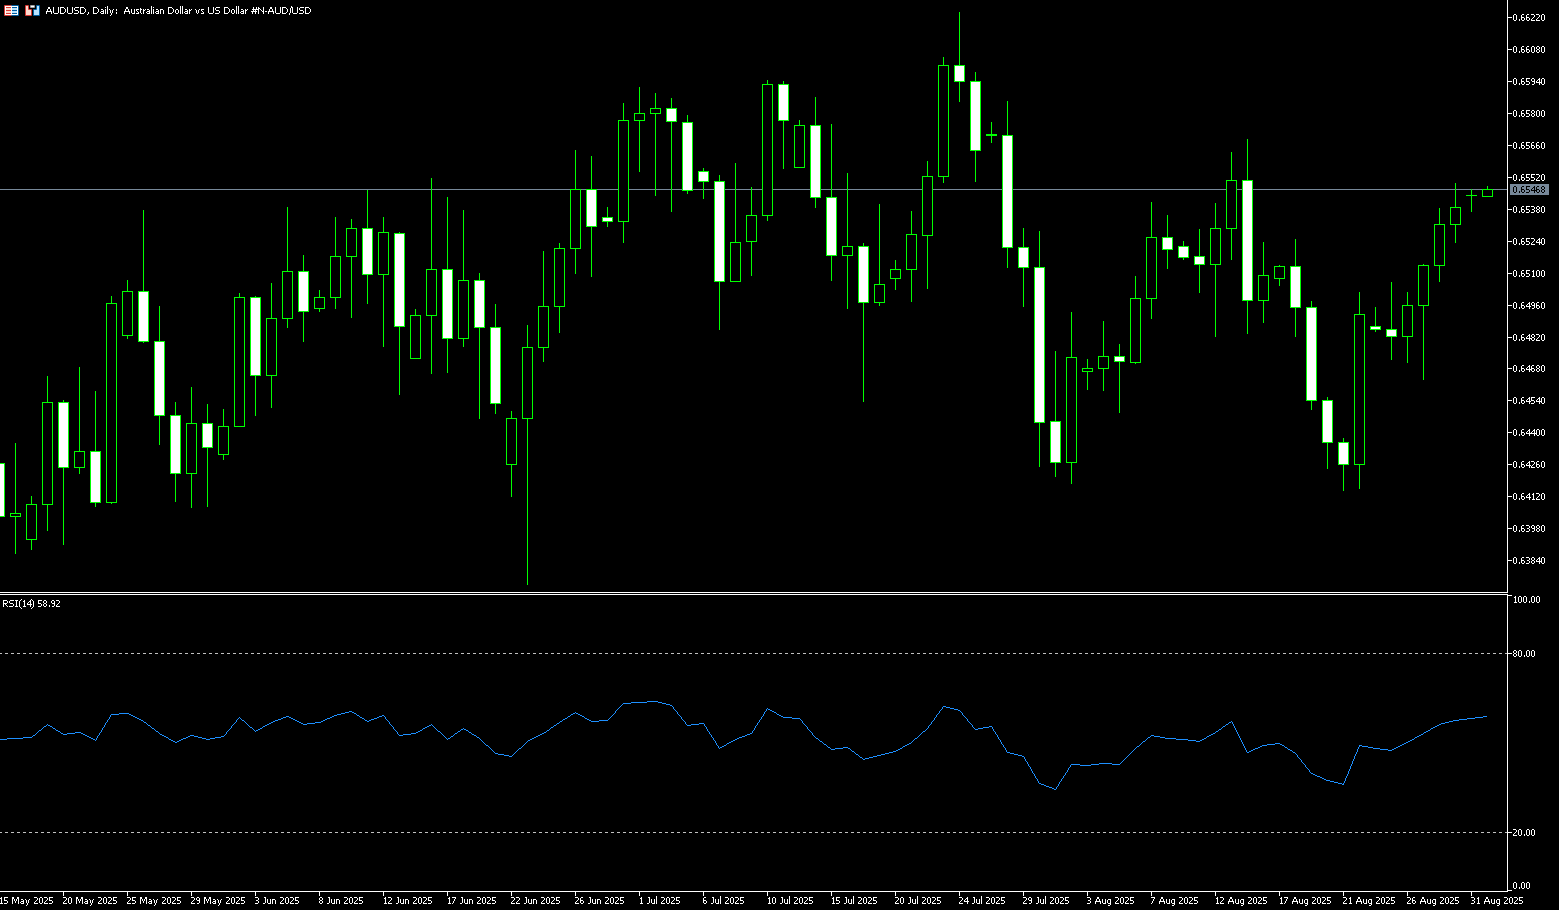
The Australian dollar rose to approximately $0.6548 before the weekend, hitting a two-week high and its fourth consecutive day of gains, as the US dollar remained under pressure. The dollar continued to be influenced by growing market expectations for a Federal Reserve rate cut next month, with Governor Christopher Waller expressing support for easing policy, while President Donald Trump's removal of Fed Governor Lisa Cook sparked fresh concerns about the central bank's independence. The Australian dollar was also supported by stronger-than-expected domestic inflation, which dampened market bets on a near-term rate cut by the Reserve Bank of Australia. However, the minutes of the August central bank meeting indicated that further cuts to the cash rate are possible over the next year, with the pace and timing depending on incoming data and global risks. Investors are now looking forward to the upcoming release of the Manufacturing Purchasing Managers' Index (PMI) for fresh insights into the country's economic momentum.
On the daily chart, AUD/USD rose to approximately $0.6548 last week, reaching a two-week high and marking its fourth consecutive day of gains. Technical analysis suggests that the pair is slightly above its rising trendline, indicating a sustained bullish bias. Furthermore, the pair is trading above its 20-day simple moving average of 0.6496, indicating strong short-term price momentum. The 14-day Relative Strength Index (RSI) is near 56, suggesting increasing upward momentum in the near term. On the upside, AUD/USD could target the monthly high of 0.6568 reached on August 14, followed by the nine-month high of 0.6625 recorded on July 24. A break below this level would target the 0.6681 level (the high of November 8 last year). On the other hand, the pair may find initial support at the 20-day simple moving average at 0.6496 and the 0.6500 round number, followed by the rising trendline around 0.6490. A break below this key support area would establish a bearish bias and prompt the pair to test the 110-day simple moving average at 0.6451.
Consider a long position on the Australian dollar at 0.6528 today, with a stop-loss at 0.6515 and targets at 0.6580 and 0.6590.
GBP/USD
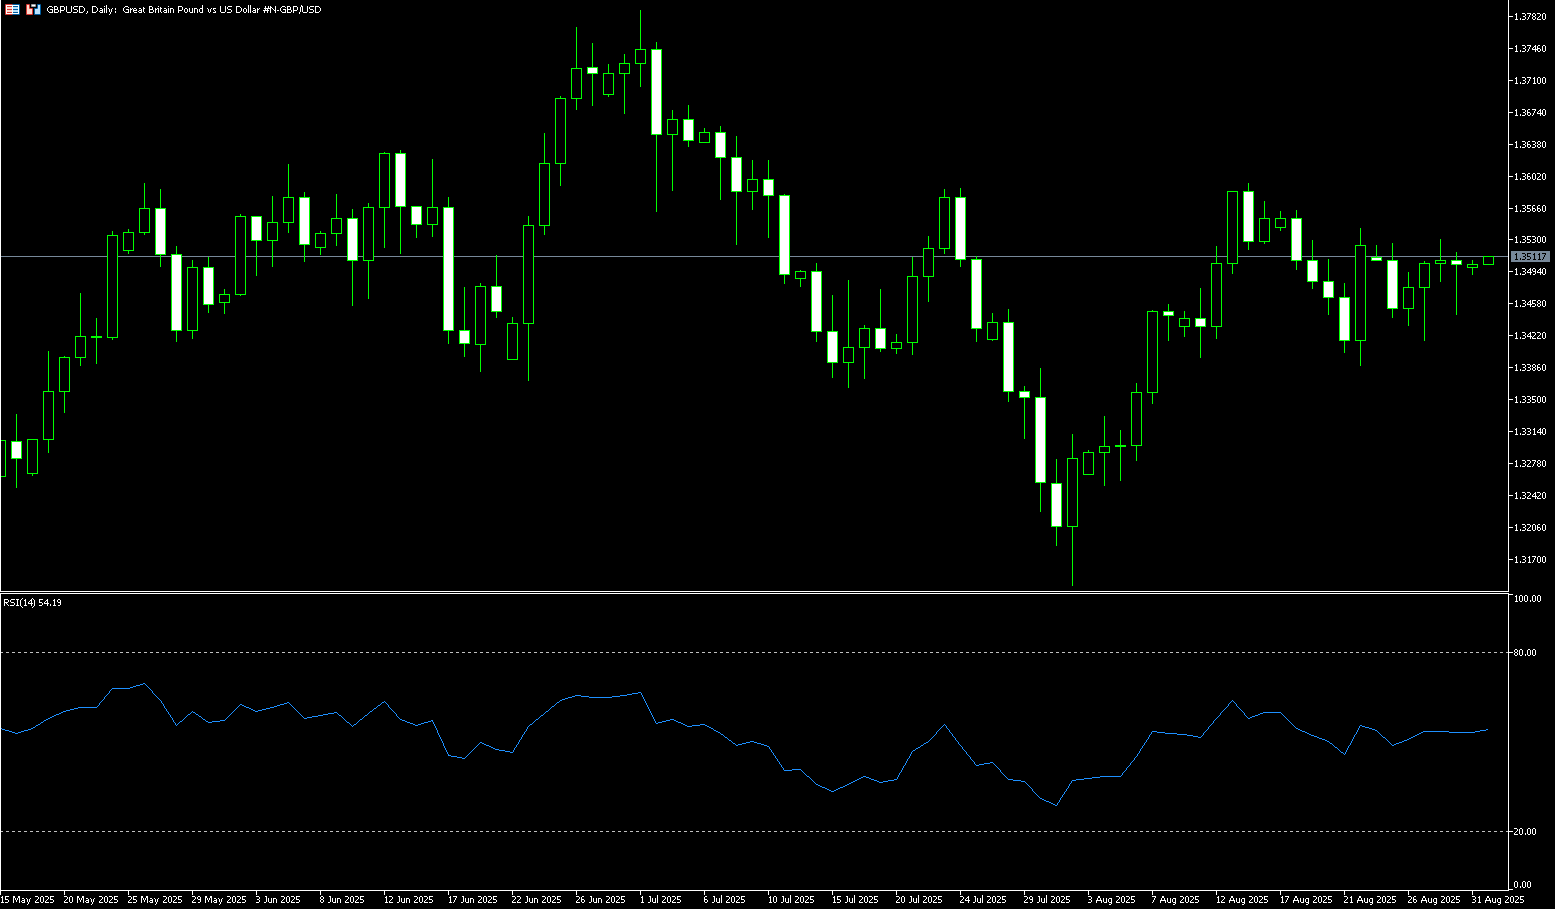
GBP/USD found support during the US trading session, stabilizing above 1.3500, after the US Personal Consumption Expenditures (PCE) price index for July, released before the weekend, was broadly in line with expectations. Data from the Bureau of Economic Analysis indicated that the core PCE price index rose 0.3% month-over-month in July, in line with expectations and consistent with the growth rate in June. Overall, PCE inflation remains the primary driver of market sentiment regarding the Federal Reserve's monetary policy outlook. However, the impact is expected to be limited this time as rate-setting members are more focused on cooling labor market conditions, stemming from sharp downward revisions to non-farm payroll data in May and June. On Thursday, Federal Reserve Governor Christopher Waller also warned of downside risks to the labor market while indicating he would support a 25 basis point rate cut at the September policy meeting. "While there are signs that the labor market is weakening, I am concerned that conditions could deteriorate further and more rapidly," Waller said, according to Reuters. Looking ahead, the main trigger for the pound will be next week's release of UK retail sales data for July. Economists expect retail sales, a key indicator of consumer spending, to grow at a modest pace.
The daily chart shows that GBP/USD continued to fluctuate within a narrow range between 1.3530 and 1.3420 last week, trading around 1.3500 before the weekend. The overall trend for GBP/USD remains sideways, trading close to its 20-day simple moving average, which is around 1.3501. The currency pair has also formed a bullish head-and-shoulders bottom pattern on the daily chart, signaling a bullish reversal after a correction or downtrend. The neckline of the head-and-shoulders bottom is located near 1.3580. A break above the neckline would measure the rise to 1.4020: 1.3580 (neckline) + [1.3580 - 1.3140 (low)] = 1.4020. Short-term upward resistance is initially at 1.3530 (last week's high), followed by 1.3580 (neckline). A break below this level would target 1.3662 (July 7 high). Meanwhile, the 14-day relative strength index (RSI) is trading near 50.00, suggesting a contraction in volatility. Looking down, 1.3465 (89-day simple moving average) will serve as key support. Further strength is expected to test the August 11 low of 1.3400, and the August 7 low of 1.3345.
Consider a long position on GBP at 1.3493 today, with a stop-loss at 1.3480 and a target of 1.3550 or 1.3560.
USD/JPY
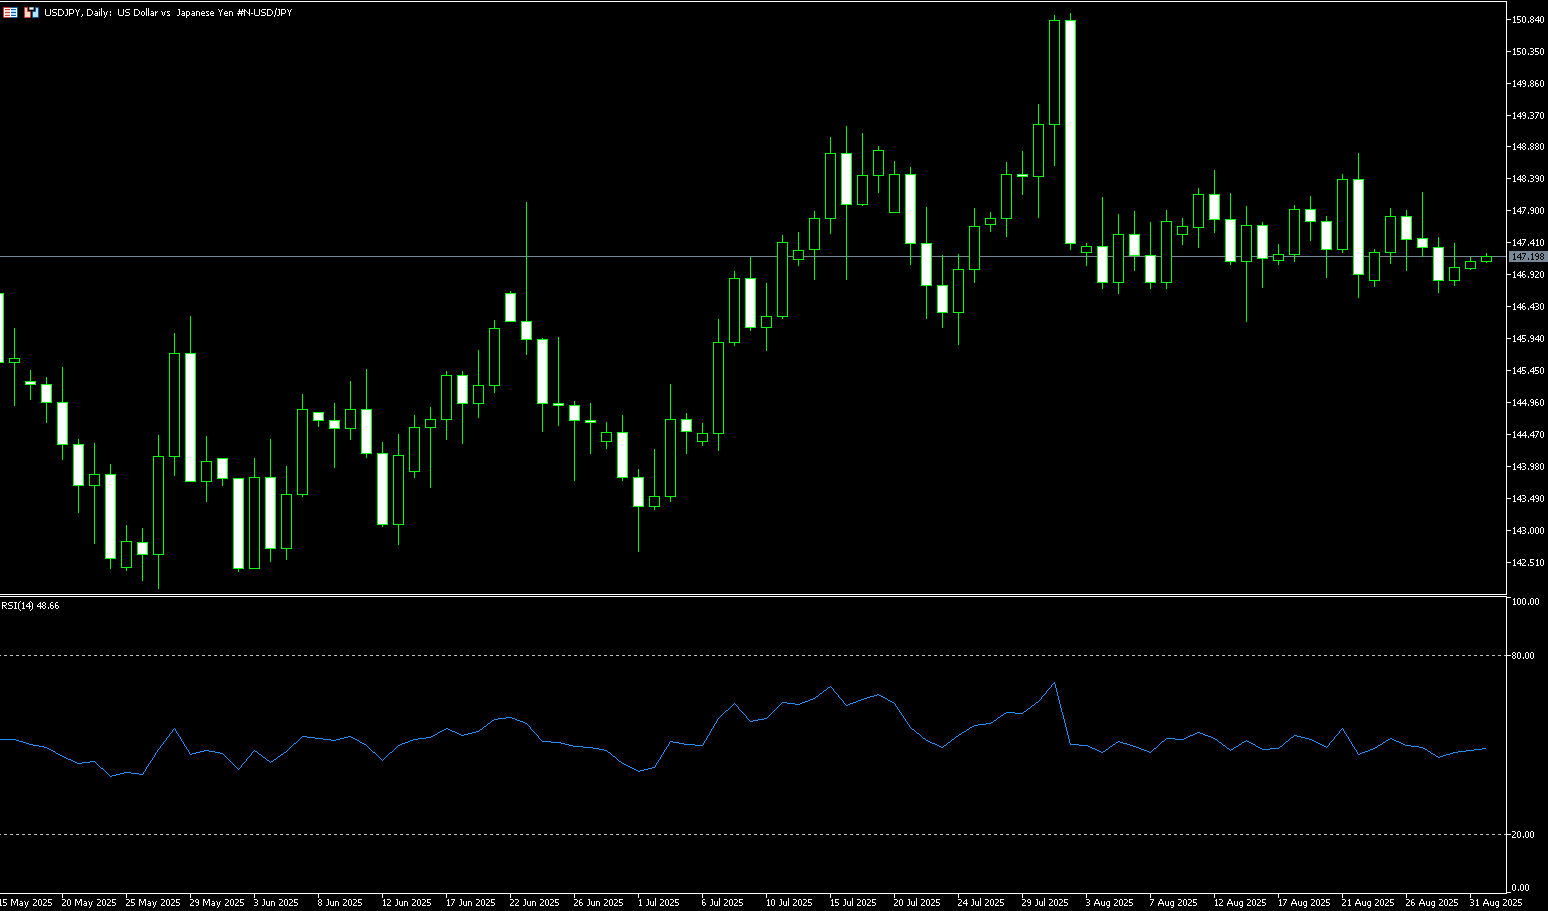
USD/JPY remained range-bound between 148.18 and 146.76 last week, trading sideways for nearly four weeks as investors digested a series of economic reports. July data showed that both industrial production and retail sales fell short of expectations, while Tokyo's core inflation rate remained above the Bank of Japan's 2% target. Meanwhile, the unemployment rate fell to 2.3% from 2.5% in June, indicating continued labor market strength. On the trade front, Japan's chief negotiator, Yoshimasa Akasawa, canceled a planned trip to Washington this week as Tokyo worked to resolve issues in its trade agreement with the United States in order to finalize the deal. Meanwhile, Bank of Japan Governor Kazuo Ueda recently stated that wages are expected to rise further as labor conditions tighten, reinforcing expectations that another rate hike is imminent. At its July meeting, the Bank of Japan kept interest rates unchanged but raised its inflation forecast and adopted a more optimistic economic outlook.
From a technical perspective, USD/JPY closed below its 50-day moving average (147.01) for the first time since early July. Momentum indicators have turned bearish: the Relative Strength Index (RSI) fell below its 50-day moving average, near 47, while the MACD entered negative territory. Meanwhile, bearish formations along the moving averages above the USD/JPY pair are suppressing any potential rebound. While USD/JPY remains stuck in the sideways trading range it has maintained since early August, downside risks may be emerging. The pair closed below the key 50-day moving average (147.01) for the first time since early July, breaking the pattern of rebounds on tests of the moving average in recent weeks. This suggests that the 45-day moving average may have shifted from support to resistance. The pair staged a strong rebound near 146.23 on August 14, making this level the first target for bears. Support lies below the 146.00 round-number mark and the 100-day moving average at 145.54. On the upside, Wednesday's bearish "shooting star" high of 148.18 is a key resistance point for the pair's rebound. Earlier this month, 148.78, the August 22 high, also triggered a sharp reversal. Just above this level lies the 200-day moving average at 148.92 and resistance at 149.00. Absent significant hawkish signals on US interest rates, this resistance area may be difficult to reach.
Consider shorting the US dollar at 147.30 today. Stop-loss: 147.50, Target: 146.30, 146.20.
EUR/USD
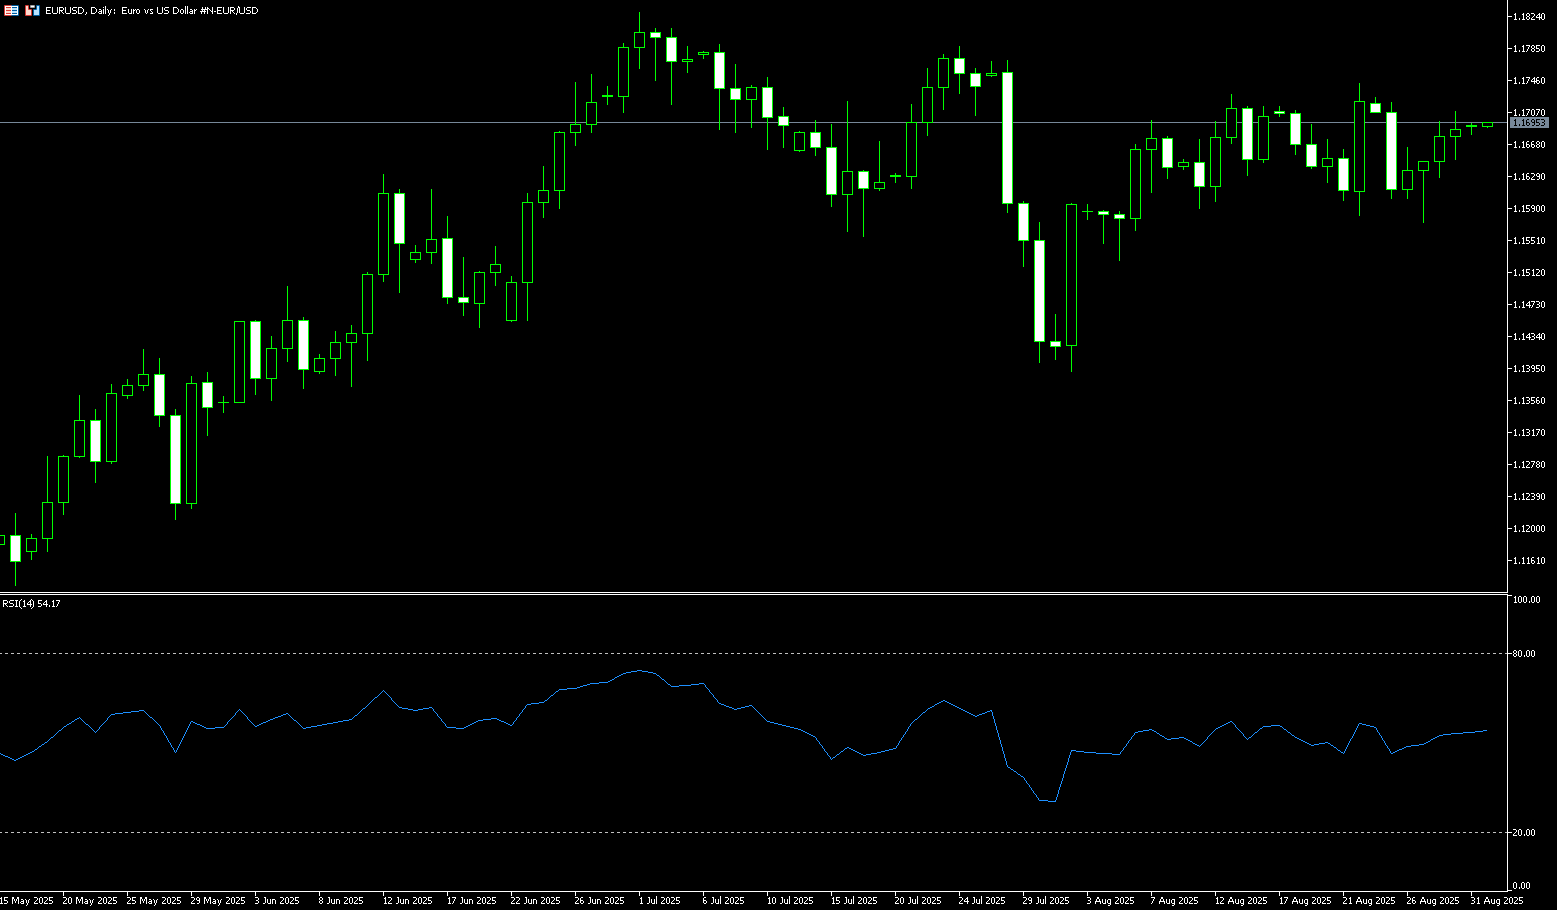
The euro came under pressure against the dollar before the weekend, stabilizing around 1.1680 after the US July personal consumption expenditures (PCE) inflation report came in broadly in line with expectations. According to the Bureau of Economic Analysis, the core PCE price index rose 0.3% month-over-month in July, in line with expectations and unchanged from June's pace. On an annual basis, core inflation rose from 2.8% to 2.9%, the highest level since February. The headline PCE price index rose 0.2% month-over-month, in line with expectations, but still slightly below June's 0.3%, while the annual rate remained at 2.6%. The euro has rallied against the dollar for most of the year, as markets weighed global interest rate outlooks and ECB policy amid concerns about slower growth. The latest price data showed that inflation in Germany accelerated more than expected to above 2%, while inflation in France, Italy, and Spain fell short of expectations, at 0.8%, 1.7%, and 2.7%, respectively. Interest rate futures suggest limited ECB rate cuts this year, although US tariffs and weak economic growth have led some to believe a year-end cut is possible. The euro has risen 11% against the US dollar so far this year, supported by EU stimulus plans and US fiscal uncertainty.
From a technical perspective, the EUR/USD pair has made little progress. The daily chart shows that the slightly bullish 20-day simple moving average provides intraday support, with a break below it quickly triggering renewed buying. The SMA, currently around 1.1654, has been EUR/USD's comfort zone for much of August. Meanwhile, the 100-day SMA at 1.1504 remains below the short-term moving average but lacks sufficient momentum for a bullish breakout. The 14-day relative strength index (RSI) shows a slightly rising bullish trend within positive territory. Once the pair breaks through the round-figure mark of 1.1700, it will be able to reach the next relevant resistance level of 1.1742 (August 22 high). Further gains will expose the 1.1830 level (the yearly high). On the other hand, support lies near the 60-day SMA at 1.1636, followed by the aforementioned 80-day SMA at 1.1549.
Consider a long EUR at 1.1673 today, with a stop loss of 1.1660 and a target of 1.1730 or 1.1640.
Disclaimer: The information contained herein (1) is proprietary to BCR and/or its content providers; (2) may not be copied or distributed; (3) is not warranted to be accurate, complete or timely; and, (4) does not constitute advice or a recommendation by BCR or its content providers in respect of the investment in financial instruments. Neither BCR or its content providers are responsible for any damages or losses arising from any use of this information. Past performance is no guarantee of future results.
More Coverage


Risk Disclosure:Derivatives are traded over-the-counter on margin, which means they carry a high level of risk and there is a possibility you could lose all of your investment. These products are not suitable for all investors. Please ensure you fully understand the risks and carefully consider your financial situation and trading experience before trading. Seek independent financial advice if necessary before opening an account with BCR.