


0
US Dollar Index
The US dollar index hovered below 98.00 on Thursday, having given up intraday gains in the previous session as traders increased bets on a Federal Reserve rate cut. The US dollar index, which measures the value of the US dollar (USD) against six major currencies, continued its decline for a third consecutive trading day, trading around 98.00 during the European session on Thursday. Technical analysis on the daily chart shows that the US dollar index remains within a descending channel pattern, suggesting a persistent bearish bias. The market now sees an approximately 89% probability of a 25 basis point rate cut in September, up from 82% a week ago. This change follows President Trump's attempt to remove Federal Reserve Governor Lisa Cook and nominate a more dovish candidate, further expanding his influence over the central bank. New York Fed President John Williams further strengthened his dovish tone by signaling on Wednesday that he was considering a rate cut. Looking ahead, investors await Friday's PCE price index (the Fed's preferred inflation measure) for further policy cues.
The dollar's short-term trajectory is driven by two key variables: the outlook for Federal Reserve policy and the potential impact of political factors on the central bank's independence. Market sentiment is clearly leaning toward easing. The US dollar index has been fluctuating and weak recently, currently trading below its 9-day moving average at 98.23, indicating a strengthening short-term bearish trend. The 14-day Relative Strength Index (RSI) is trading below its 50-day midline, indicating a dominant bearish trend in the short term, but has not yet entered a severely oversold zone, suggesting further downside potential. Short-term testing is expected at 97.68 (the low of August 25) and 97.11 (the low of July 24). On the upside, the 9-day moving average at 98.23 constitutes short-term resistance. If broken through, it could potentially test the 100-day moving average at 98.778.
Consider shorting the US Dollar Index at 97.96 today, with a stop loss of 98.08 and a target of 97.50 or 97.40.
WTI Spot Crude Oil
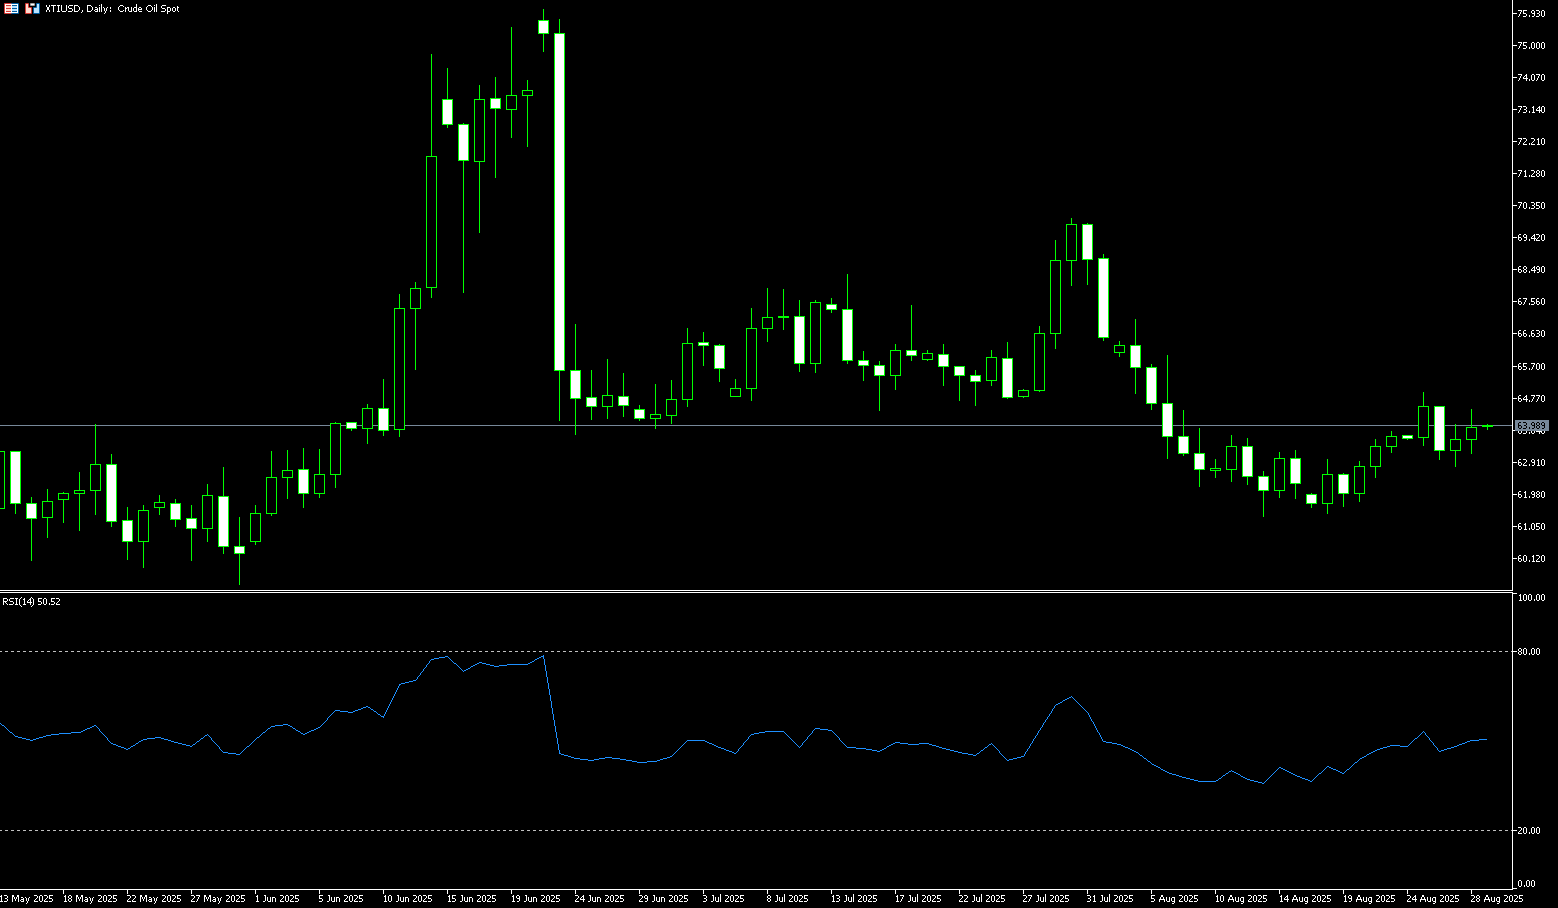
WTI crude oil fell to around $64.00 per barrel on Thursday as investors weighed weak US fuel demand against the end of the summer driving season and potential supply fluctuations in India, which faces high US tariffs. US crude oil inventories fell by 2.39 million barrels to 418.3 million barrels, exceeding forecasts, while Cushing inventories fell by 838,000 barrels, reflecting strong demand ahead of Labor Day. However, analysts noted that the holiday typically marks the end of peak driving season and weakening consumption. Traders were also focused on India's response to US pressure to limit Russian oil imports, although analysts expect India to continue buying in the short term, limiting the global impact. Losses were partially offset by intensified attacks on energy infrastructure in Russia and Ukraine and optimism about potential US interest rate cuts to support demand.
Judging from the current trend, oil prices face a complex mix of bullish and bearish factors: declining inventories and geopolitical tensions provide support, while a seasonally low US demand and tariff pressures in India are limiting upside potential. In the short term, the market is likely to remain range-bound between $60 and $65, with future trends depending more on the Federal Reserve's interest rate decisions and the specific response of India's energy policies. On a daily basis, US crude oil has found repeated support at $61.45 (the low reached on August 18) and $60 (a psychologically important level), forming a temporary bottom. However, resistance around $65 and $65.76 (the 50.0% Fibonacci retracement level from $54.78 to $76.74) remains unbroken. If inventories continue to decline and demand remains strong, oil prices are expected to break through the $65 resistance level; otherwise, a retest of $60 is possible.
Consider going long on crude oil at 63.90 today. Stop-loss: 63.70. Target: 65.40, 65.70.
Spot Gold
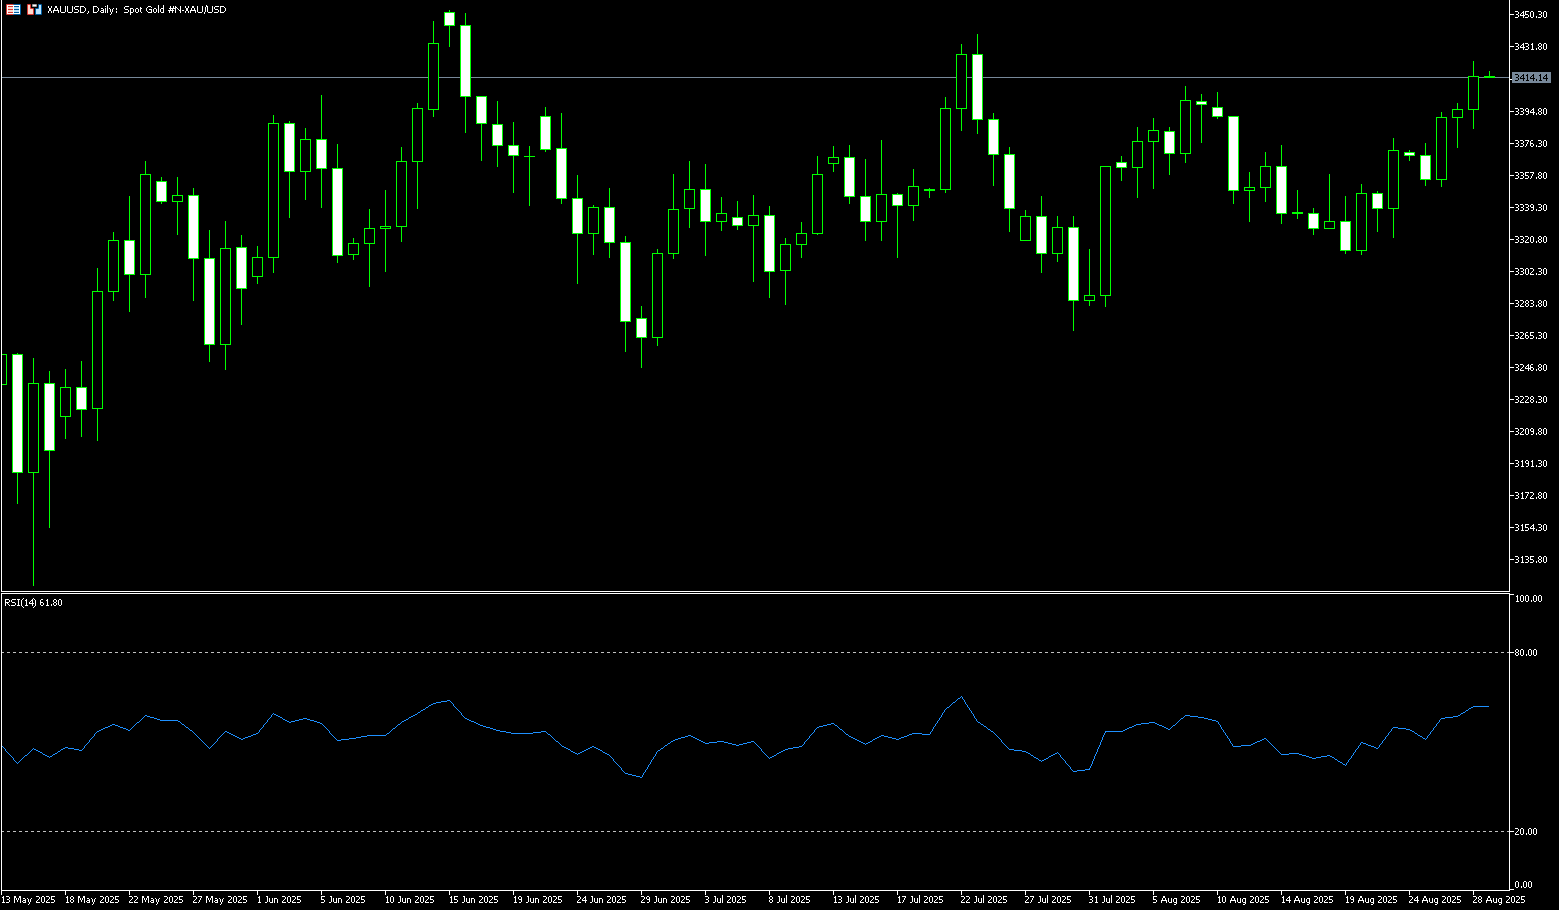
Gold prices rose above $3,415 per ounce on Thursday, reaching a five-week high, as a weaker dollar and safe-haven demand pushed up the metal's price. A 0.4% drop in the dollar made gold bars more attractive to overseas buyers, boosting demand. Prices have risen for more than a week, driven by concerns that political pressure on the Federal Reserve could lead to faster and deeper interest rate cuts. The market is now pricing in an 87% probability of a 25 basis point rate cut in September, with attention turning to Friday's PCE inflation report for further guidance. Uncertainty also increased after Federal Reserve Governor Lisa Cook filed a lawsuit challenging Trump's removal of her, highlighting risks to the central bank's independence. Meanwhile, unemployment claims declined, but signs of weakening labor market momentum and the prospect of higher unemployment reinforced expectations of a more dovish Fed stance, providing support for gold.
The positive outlook for gold prices remains intact, with prices consolidating above the key 9-day simple moving average of $3,362 on the daily chart. The 14-day relative strength index (RSI) is above its midline near 61.00, suggesting a strong likelihood of further gains in the near term. Immediate resistance for gold lies at the upper Bollinger Band level at $3,416. A break above this level could pave the way for $3,439 (the July 23 high). Further upside, the next hurdle lies at the all-time high of $3,500. Initial support for the gold/USD pair lies at the 9-day simple moving average of $3,362 and $3,352 (the August 26 low). A continued decline could lead to a drop to the $3,331 (100-day simple moving average) level.
Consider going long on gold at $3,410 today, with a stop-loss at $3,405 and a target of $3,430.
AUD/USD
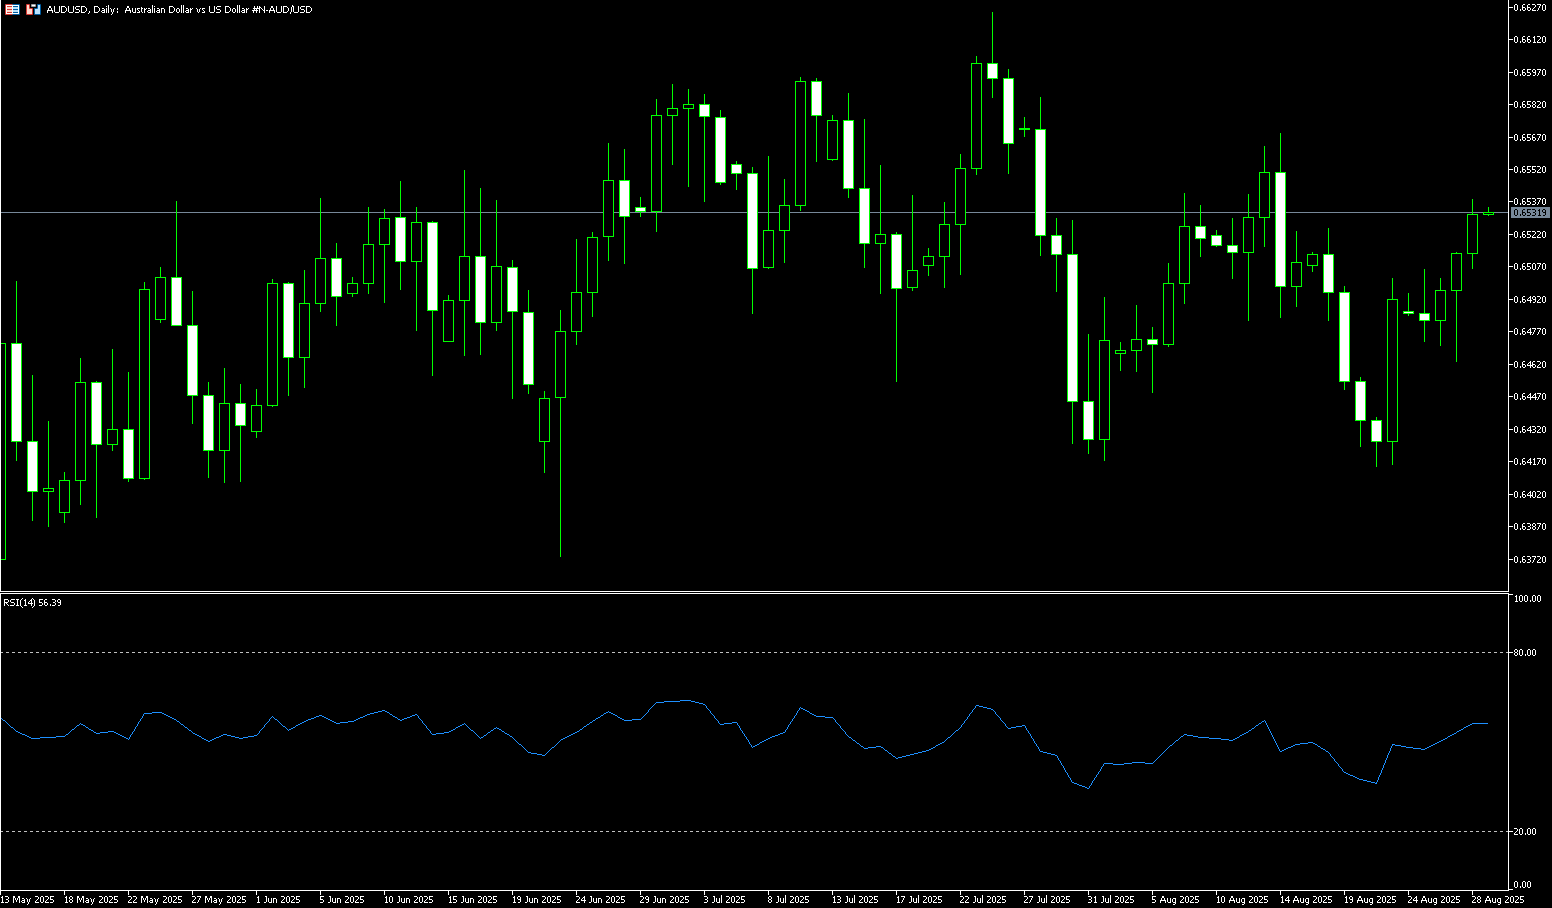
The Australian dollar appreciated to around $0.6525 on Thursday, extending its third consecutive session of gains, supported by the Reserve Bank of Australia's cooling of expectations for another near-term rate cut. Market pricing now suggests only approximately 34 basis points of additional easing room for the remainder of 2025, with the probability of a September rate cut falling to around 25%. Analysts expect the central bank to wait until its November meeting to begin another rate-cutting cycle. The Australian dollar was also supported by a weaker US dollar, as traders increased bets on a September Fed rate cut after New York Fed President John Williams indicated the option was under discussion. President Donald Trump's attempts to expand his influence over the central bank, seeking to remove Federal Reserve Board member Lisa Cook in favor of a more dovish nominee, also weighed on market sentiment. Separately, local data showed an increase in business investment in the June quarter, with strength in the data center and logistics sectors.
AUD/USD traded around 0.6525 on Thursday. Technical analysis on the daily chart shows the pair slightly above its ascending trendline, suggesting a bullish bias. Furthermore, the pair is trading above its 100-day simple moving average at 0.6475, indicating strengthening short-term price momentum. On the upside, AUD/USD could explore the monthly high of 0.6568 reached on August 14, followed by the psychologically important 0.6600 level. Near-term support lies at the round-number mark of 0.6500. A break below these levels would weaken short- to medium-term price momentum and exert downward pressure towards a test of the 100-day simple moving average at 0.6475. Further declines would push the pair towards a test of the two-month low of 0.6415 recorded on August 21.
Consider a long position on the Australian dollar at 0.6515 today, with a stop-loss of 0.6505 and targets of 0.6550 and 0.6560.
GBP/USD
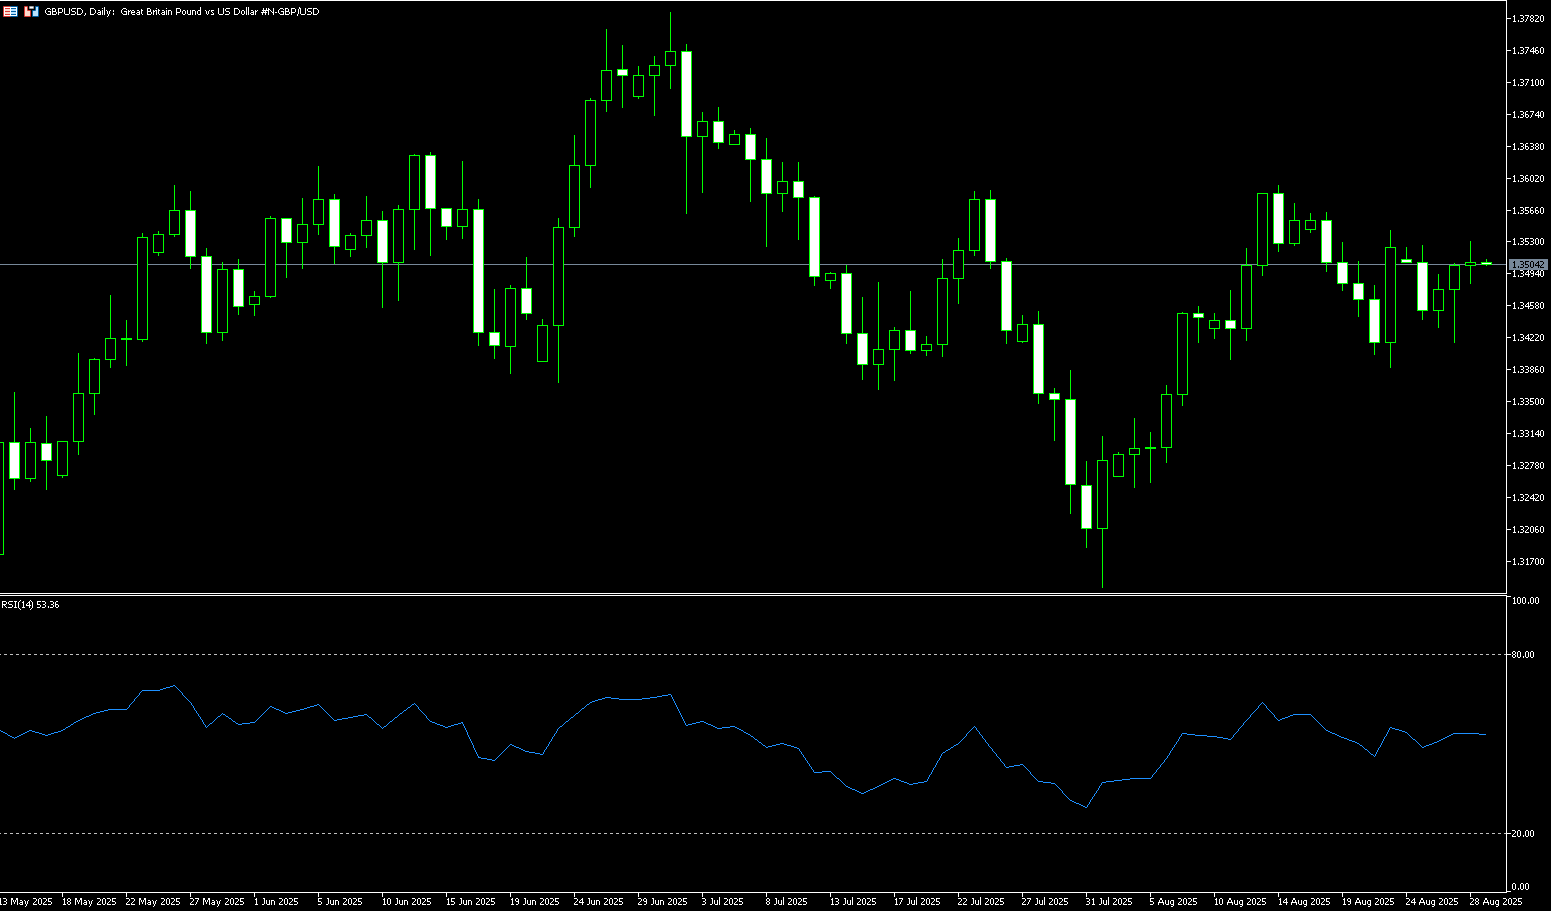
GBP/USD remained stable after two consecutive days of gains, trading above 1.3500 during Thursday's Asian session. Further appreciation is possible as the US dollar struggles amid growing concerns about the independence of the Federal Reserve System. US President Trump announced earlier that he was removing Federal Reserve Governor Lisa Cook from her position on the Fed's board. He also stated that he was prepared to engage in a legal battle with Cook over allegations of forged mortgage documents. GBP/USD was little changed following the release of retail sales data from the Confederation of British Industry (CBI). While businesses still face high costs, they are raising prices at a slower pace than earlier in the summer, a trend that has led the Bank of England to remain cautious about services inflation.
Technically, GBP/USD recently broke out of a bearish regression channel, indicating a bullish trend. However, the price gains were unsustainable due to low market volatility in August. The daily chart shows GBP/USD consolidating, having broken above the 9-day simple moving average at 1.3480 and currently testing just above the psychological level of 1.3500. From a momentum technical perspective, the 14-day relative strength index (RSI) remains flat around 52, suggesting a lack of catalysts that could increase volatility in the pair. On the upside, GBP/USD could test the August 27 high of 1.3544, with a breakout leading to the 1.3600 round number. Conversely, if the pair breaks below the 9-day simple moving average at 1.3480, the next areas of focus would be the 25-day simple moving average at 1.3425, followed by the 1.3400 round number.
Consider going long on the British pound at 1.3500 today, with a stop-loss at 1.3490 and targets at 1.3560 and 1.3550.
USD/JPY
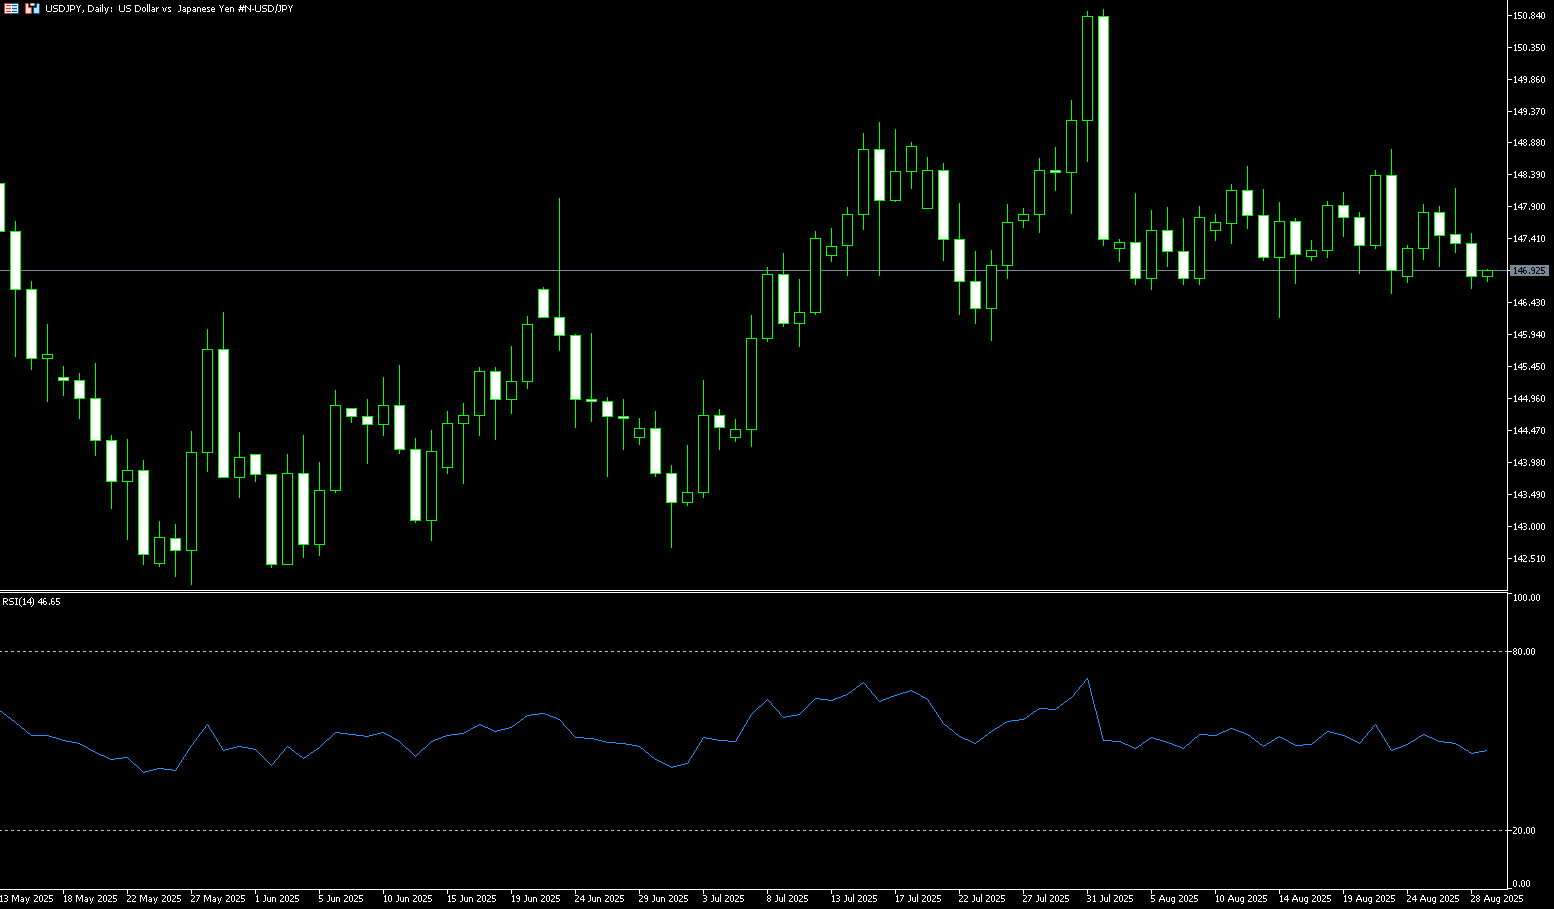
The yen held steady around 147.00 per dollar on Thursday, extending its nearly four-week sideways trading pattern as investors braced for an upcoming wave of economic data. On Friday, markets will analyze reports on industrial production, retail sales, and consumer confidence. Tokyo's inflation data—considered a leading indicator of nationwide price trends—will also be closely watched for signals on Bank of Japan policy. Over the weekend, Bank of Japan Governor Kazuo Ueda stated that wages are expected to rise further as the labor market tightens, reinforcing expectations that conditions are maturing for another rate hike. At its July meeting, the Bank of Japan kept interest rates unchanged but raised its inflation forecast and struck a more optimistic tone about the economy.
The dollar gave up gains against the yen after a three-day rally as investors pondered the consequences of US President Trump's attempts to control the Federal Reserve and President Timothy Cook's decision to sue the president. From a technical perspective, USD/JPY is currently at a critical juncture. On the downside, the pair has found strong short-term support near the 55-day simple moving average of 146.80. A break below this level could lead to further declines to the recent low of 146.21. A break below this level could target the 145.50 level. On the upside, the pair has shown strong momentum in recent rebounds, but remains under pressure from key resistance levels at the 148.00 round-figure mark and the 170-day simple moving average of 148.09. A break above this resistance level could open up further upside potential, with bulls targeting the 200-day simple moving average at 148.96. The pair could also test the psychological 150.00 level.
Consider shorting the USD at 147.15 today. Stop-loss: 147.30, target: 146.40-146.20.
EUR/USD
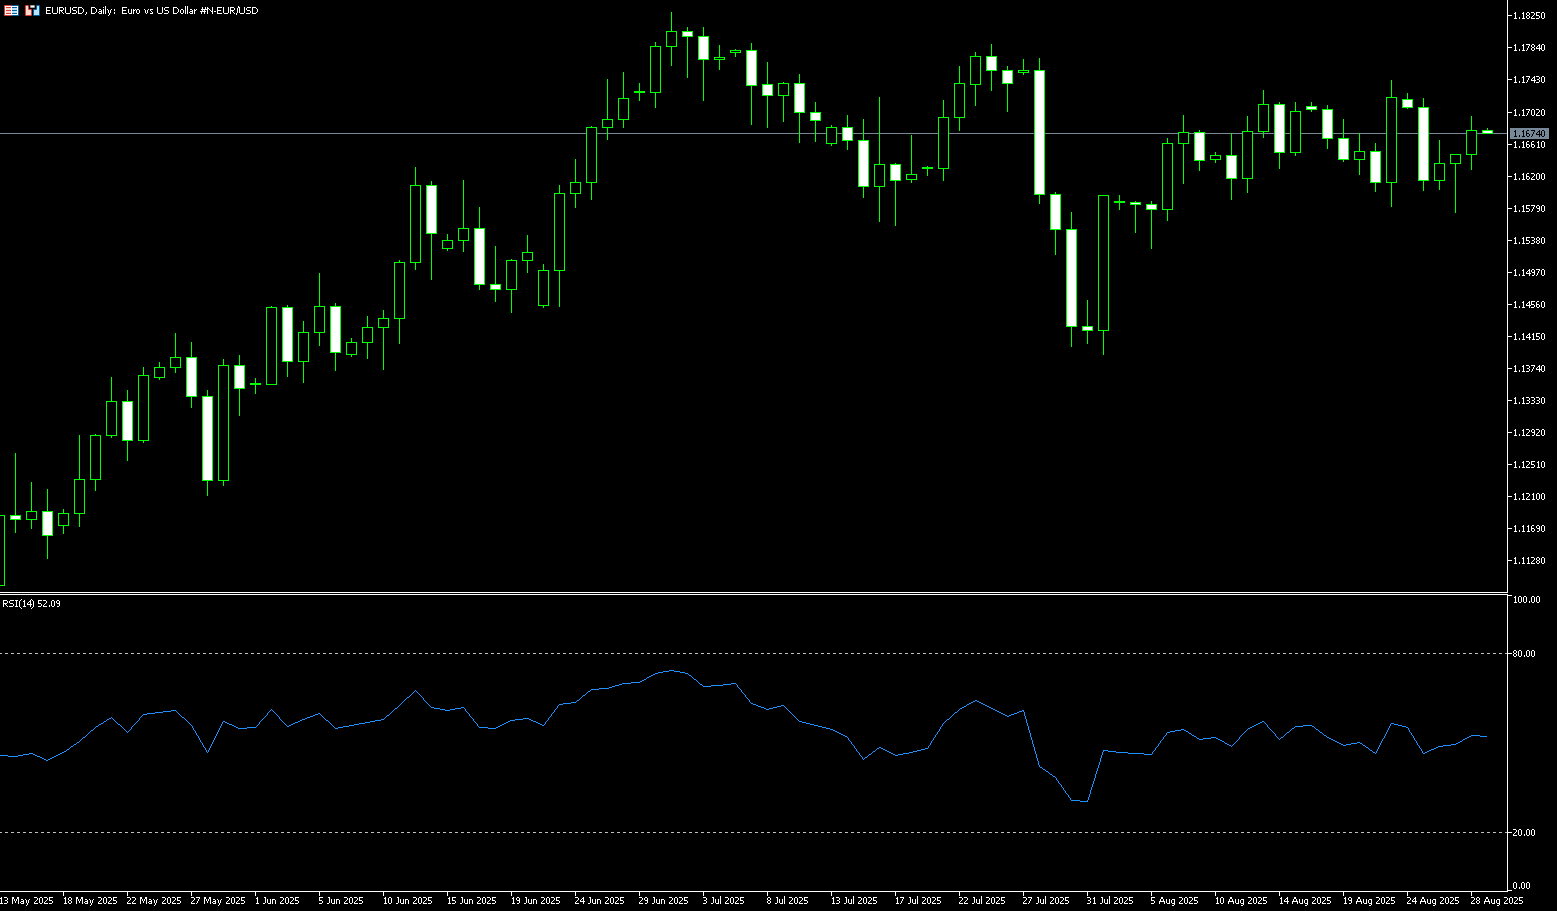
During Thursday's Asian trading session, EUR/USD rose to near 1.1670. Major currency pairs saw slight gains as the US dollar faced selling pressure following dovish interest rate comments from New York Federal Reserve Bank President John Williams during a CNBC interview on Wednesday. Midweek, Williams supported a rate cut but expressed less confidence in the September policy meeting, noting that officials would need to review economic data at that time. Meanwhile, traders, according to the CME FedWatch tool, are pricing in an 87% probability of a rate cut at the Fed's September meeting. In the eurozone, rising risks of a snap election in France are limiting the euro's upside. Earlier this week, French Prime Minister François Bayrou called for a vote of confidence on his €44 billion budget plan on September 8th. On the economic front, investors awaited Friday's release of preliminary August inflation data from major eurozone economies.
The daily chart suggests the recent structure can be described as "weak, consolidating, and bearish." After reaching two highs at 1.1729 and 1.1742, the price failed to continue its upward trend, forming a dense resistance band above. It has since fluctuated downward, repeatedly finding support near this week's low at 1.1575, but the rebound has gradually weakened. The exchange rate is currently hovering near the Bollinger Band's center line at 1.1670, indicating a lack of smooth upward momentum in the short- to medium-term. Regarding technical indicators, the MACD is below zero, indicating a slight bearish advantage, but without a steeply sloping unilateral trend. The RSI is at 49.50, below the neutral line of 50, indicating a weak position but not extreme oversold conditions. Combining the structural and indicator resonances, the key technical indicators to watch are: The downside is this week's low of 1.1575. If broken, a pullback to 1.1500 or even lower is possible. The first resistance level above is 1.1700 (a round number), and Tuesday's high of 1.1706, followed by the previous high of 1.1742 (August 22nd high).
Today, consider a long EUR at 1.1655, with a stop loss of 1.1645 and targets of 1.1725 and 1.1635.
Disclaimer: The information contained herein (1) is proprietary to BCR and/or its content providers; (2) may not be copied or distributed; (3) is not warranted to be accurate, complete or timely; and, (4) does not constitute advice or a recommendation by BCR or its content providers in respect of the investment in financial instruments. Neither BCR or its content providers are responsible for any damages or losses arising from any use of this information. Past performance is no guarantee of future results.
More Coverage


Risk Disclosure:Derivatives are traded over-the-counter on margin, which means they carry a high level of risk and there is a possibility you could lose all of your investment. These products are not suitable for all investors. Please ensure you fully understand the risks and carefully consider your financial situation and trading experience before trading. Seek independent financial advice if necessary before opening an account with BCR.