


0
US Dollar Index
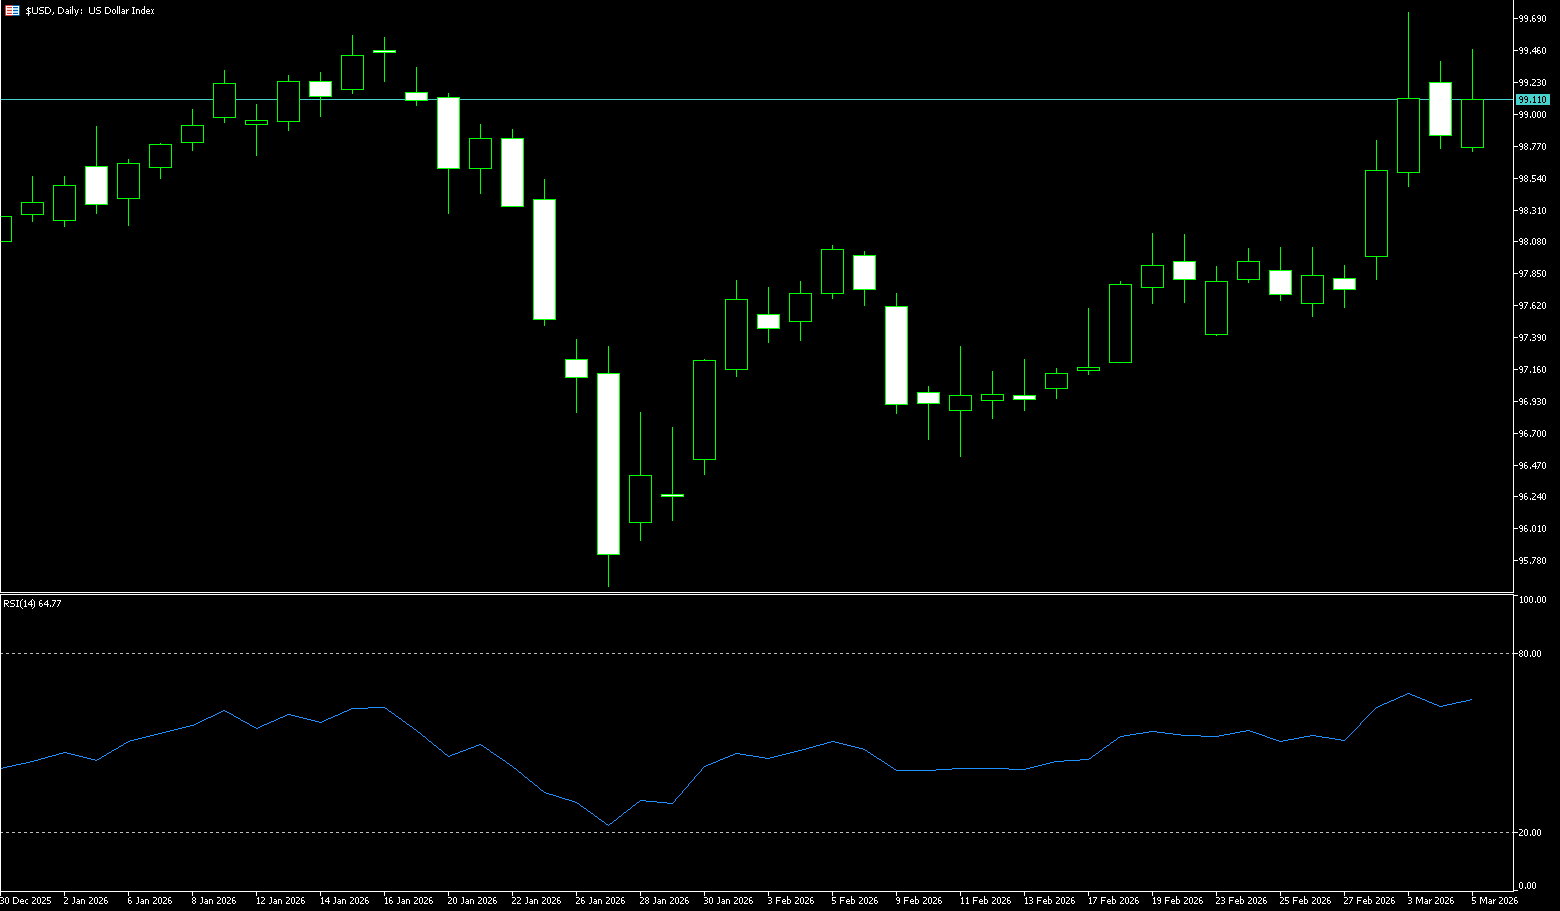
The US dollar index rose to 99.10 on Thursday, its highest level since mid-January, as escalating tensions with Iran reignited safe-haven demand. Early easing sentiment faded as the conflict entered its sixth day. Both Iran and the US indicated that attacks could escalate in the coming days, pushing up oil and gas prices, reigniting inflation concerns, and prompting traders to reduce their expectations for a Federal Reserve rate cut this year from two earlier in the week to just one. Meanwhile, recent economic data reinforced the strength of the US economy. Initial jobless claims were lower than expected, last quarter's productivity growth exceeded expectations, layoffs decreased significantly, and the ISM services PMI showed the sector expanding at its fastest pace since mid-2022. Investors also viewed the US as a relatively safe haven, further supporting the dollar given its greater energy independence. The dollar saw the most significant gains against the Australian dollar, Japanese yen, and euro.
The oil price surge triggered by Middle East geopolitical conflicts, coupled with the effects of dollar taxes, rising inflation, cooling expectations of a Fed rate cut, and an influx of global safe-haven funds, has created a resonance pattern, becoming the core driving force behind the current rise in the US dollar index. Before the situation in the Middle East shows significant easing, energy and policy logic will continue to dominate the dollar's trajectory. Technically, the US dollar index has risen to the neckline of a previous double-top pattern. Currently, the MACD indicates a bullish bias for the dollar, with support at Tuesday's low of 98.43 and the 9-day moving average around 98.21. Geopolitical changes will continue to influence the dollar's direction. If the conflict escalates, the dollar may retest the 99.30 level; a break above this level would test the week's high of 99.68.
Today, consider going long on the US Dollar Index around 98.96; Stop loss: 98.86, Target: 99.40; 99.30
WTI Crude Oil
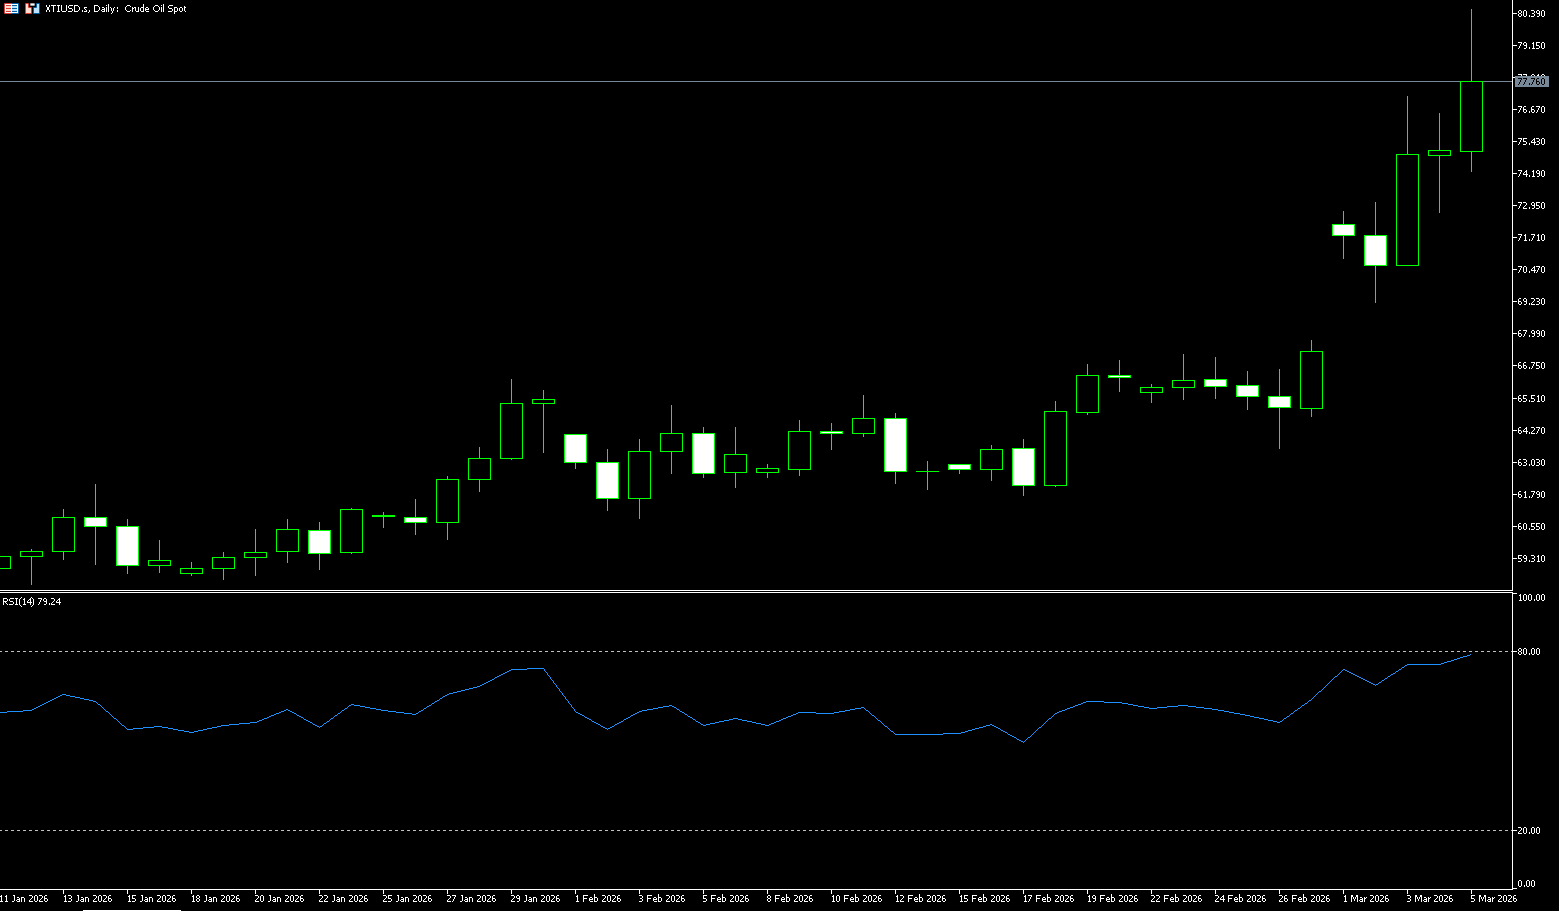
Crude oil prices rose more than 8%, breaking through $80 per barrel to reach their highest level since July 2024, as the escalating conflict with Iran disrupted global fuel supplies. Tanker traffic in the Strait of Hormuz has largely ceased after Iran claimed to have hit a tanker with a missile. Meanwhile, the Chinese government has ordered major refineries to halt diesel and gasoline exports. Attempts to calm the market, including proposals for ship insurance and naval escorts, have so far failed to reassure investors, who are increasingly prepared for a prolonged conflict. Meanwhile, EIA data showed that US crude oil inventories increased by 3.5 million barrels to 439.3 million barrels, far exceeding expectations and providing a buffer against potential supply shocks.
The current market is driven by news; continued positive news is needed to support the bulls, otherwise a pullback may occur intraday. Oil prices have shown a similar pattern daily this week. The current trend remains upward, but oil prices face multiple resistance levels, including this week's high of $80.54 and the psychological level of $80.00. Looking at the daily chart, the upward trend of WTI crude oil that started from the mid-February low of $61.80 continues, but the technical indicators have issued a clear overbought warning. The RSI is at 81.32, entering the typical overbought zone; historical data shows that the probability of a short-term pullback after this level is over 65%. The MACD indicator shows the DIFF line at 3.24, the DEA line at 2.12, and the MACD histogram at 2.25, maintaining a golden cross. In terms of price, the recent high of $80.54 forms short-term resistance, with significant selling pressure around $80; the support level is at $73.20 (the beginning of the week's high), followed by the psychological level of $70.
Today, consider going long on crude oil around 77.60; stop loss: 77.40, target: 79.00; 79.50
Spot Gold
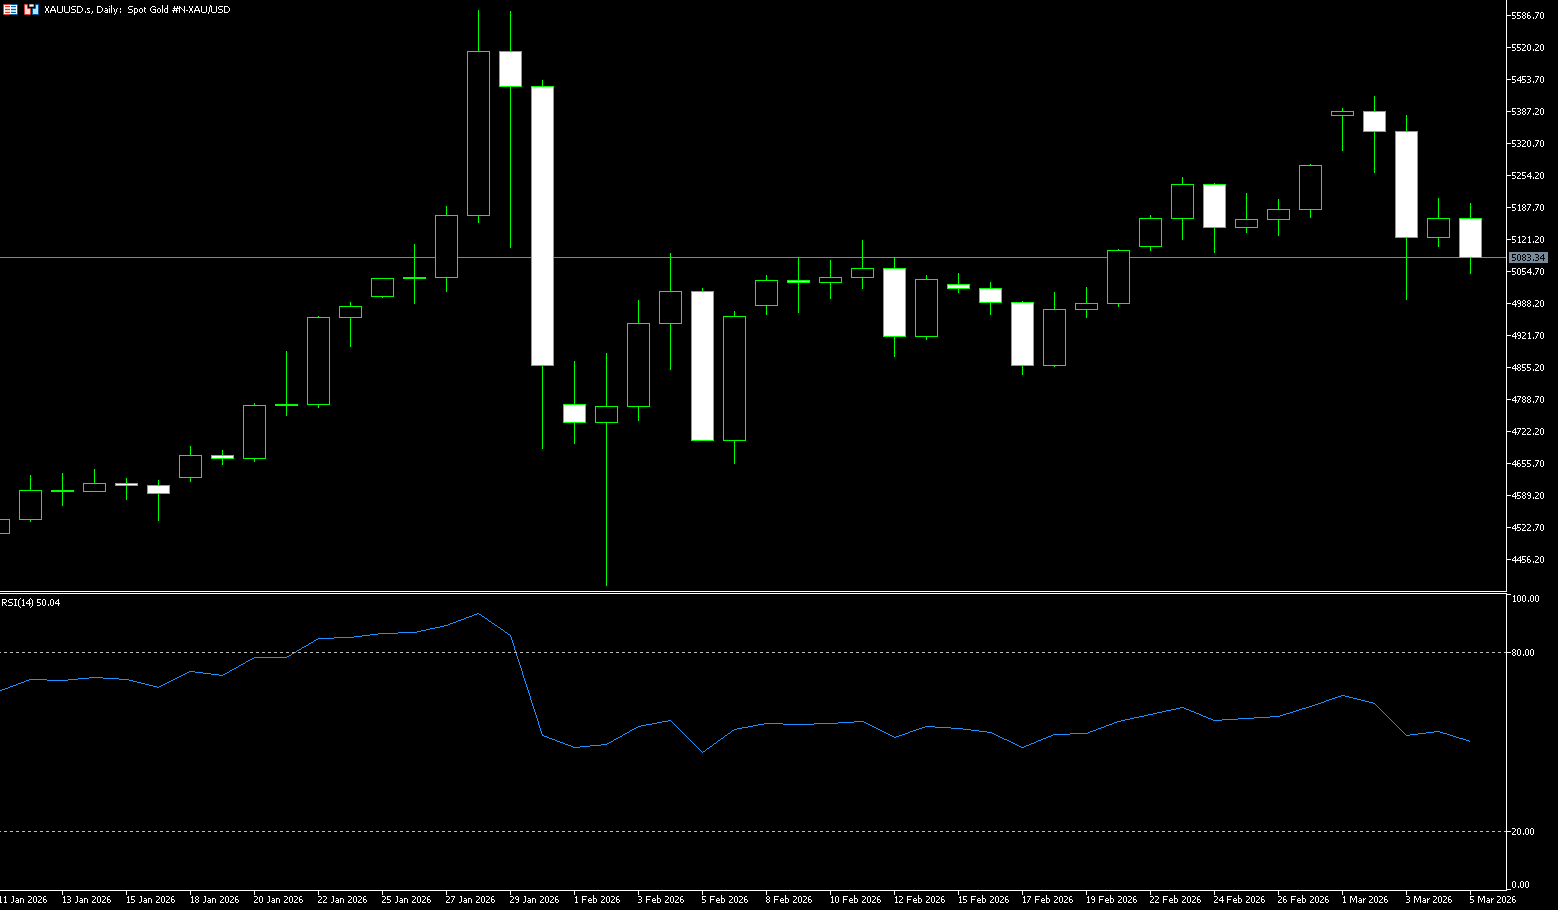
On Thursday morning, spot gold traded around $5,085 per ounce. Gold prices rose on Wednesday, with escalating Middle East conflict attracting safe-haven buying and a pause in the dollar's rise providing support. The dollar's pullback provided support for gold, while macroeconomic fundamentals and ongoing geopolitical conflicts generally remain favorable for gold. Although market volatility may continue, the overall bullish outlook remains unchanged. The conflict escalated further that day. On the economic data front, the ADP report showed that US private sector employment increased more than expected in February, but January's data was significantly revised downwards. The market is now focusing on the US February non-farm payroll report to be released on Friday. Furthermore, the global gold market is not only experiencing a price pullback but also a "desanctification" of pricing power. This week's sharp drop in gold prices has dampened the bullish sentiment: when greed in the capital markets outweighs fear, and when the sword of liquidity is wielded against the most profitable assets, gold ceases to be a safe haven and becomes the most convenient "cash cow" for institutions.
From a technical perspective, the Relative Strength Index (RSI) is at 52.12, in the neutral range, neither overbought nor oversold, indicating a temporary balance between bullish and bearish forces. The Moving Average Convergence Divergence (MACD) indicator shows a DIFF of 102.34, a DEA of 104.24, and a MACD value of -3.80, presenting a slightly bearish signal, suggesting slightly insufficient short-term momentum, but no clear reversal trend has yet formed. The next short-term downside target for the bears is to push futures prices below the strong technical support level of $5,000.00, a widely recognized important psychological level. A break below this level could trigger further technical selling down to $4,908 (the 45-day moving average). The first resistance levels are at $5,265 (February 27 high) and $5,300 (psychological level).
Consider going long on gold today around $5,080; Stop loss: $5.075; Target: $5,160; $5,180
AUD/USD
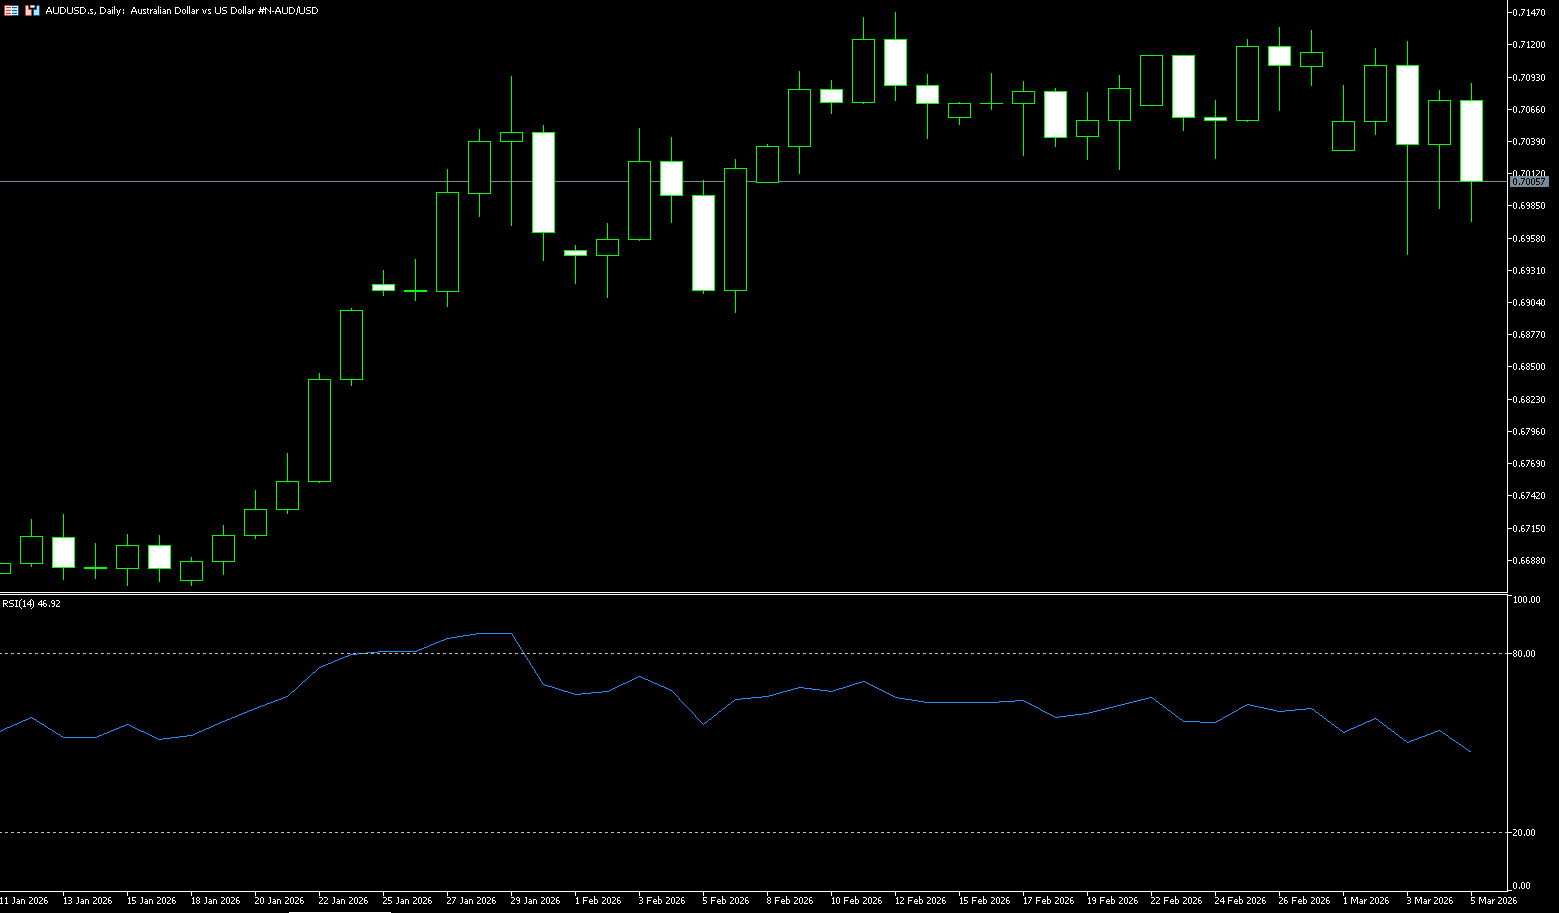
Australia's trade surplus narrowed to $2,631 million in January, compared to $3,373 million in the previous month, according to the latest foreign trade data released by the Australian Bureau of Statistics on Thursday. The market consensus was $3,900 million. Further details showed that Australian exports fell 0.9% month-on-month in January, compared to a 0.9% increase in the previous month (revised from 1.0%). Meanwhile, imports rose 0.8% month-on-month in January, compared to a 1.8% decrease in December (revised from 0.8%). The AUD/USD pair fell on the day, trading around 0.7010. The AUD/USD pair performed positively ahead of the Australian trade data release. The currency pair rose despite the US dollar ignoring positive employment data and the ISM Services PMI. Meanwhile, on the dollar side, escalating Middle East conflicts, fueled by US and Israeli strikes against Iran and the effective closure of the Strait of Hormuz, drove safe-haven flows into the dollar, although the momentum of this risk aversion weakened somewhat during midweek trading.
On the daily chart, AUD/USD is trading around 0.7010. The short-term bias is slightly bullish, as the price is firmly above the rising 40-day (0.6961) and 50-day (0.6910) simple moving averages, reinforcing the established uptrend despite recent weakening momentum. The latest stochastic oscillator reading has retreated from overbought territory but remains in the upper range, suggesting weakening upward pressure rather than a clear reversal, consistent with a consolidation phase within a broader uptrend structure. Initial support appears around 0.6961 (40-day simple moving average) and 0.7000 (psychological level). The immediate resistance level is around 0.7136 (February 26 high), slightly below the recent swing high. A break above this level would expose the 0.7147 (February 12 high) area as the next upside target.
Consider shorting the Australian dollar around 0.7020 today; Stop loss: 0.7030; Target: 0.6980; 0.6970
GBP/USD
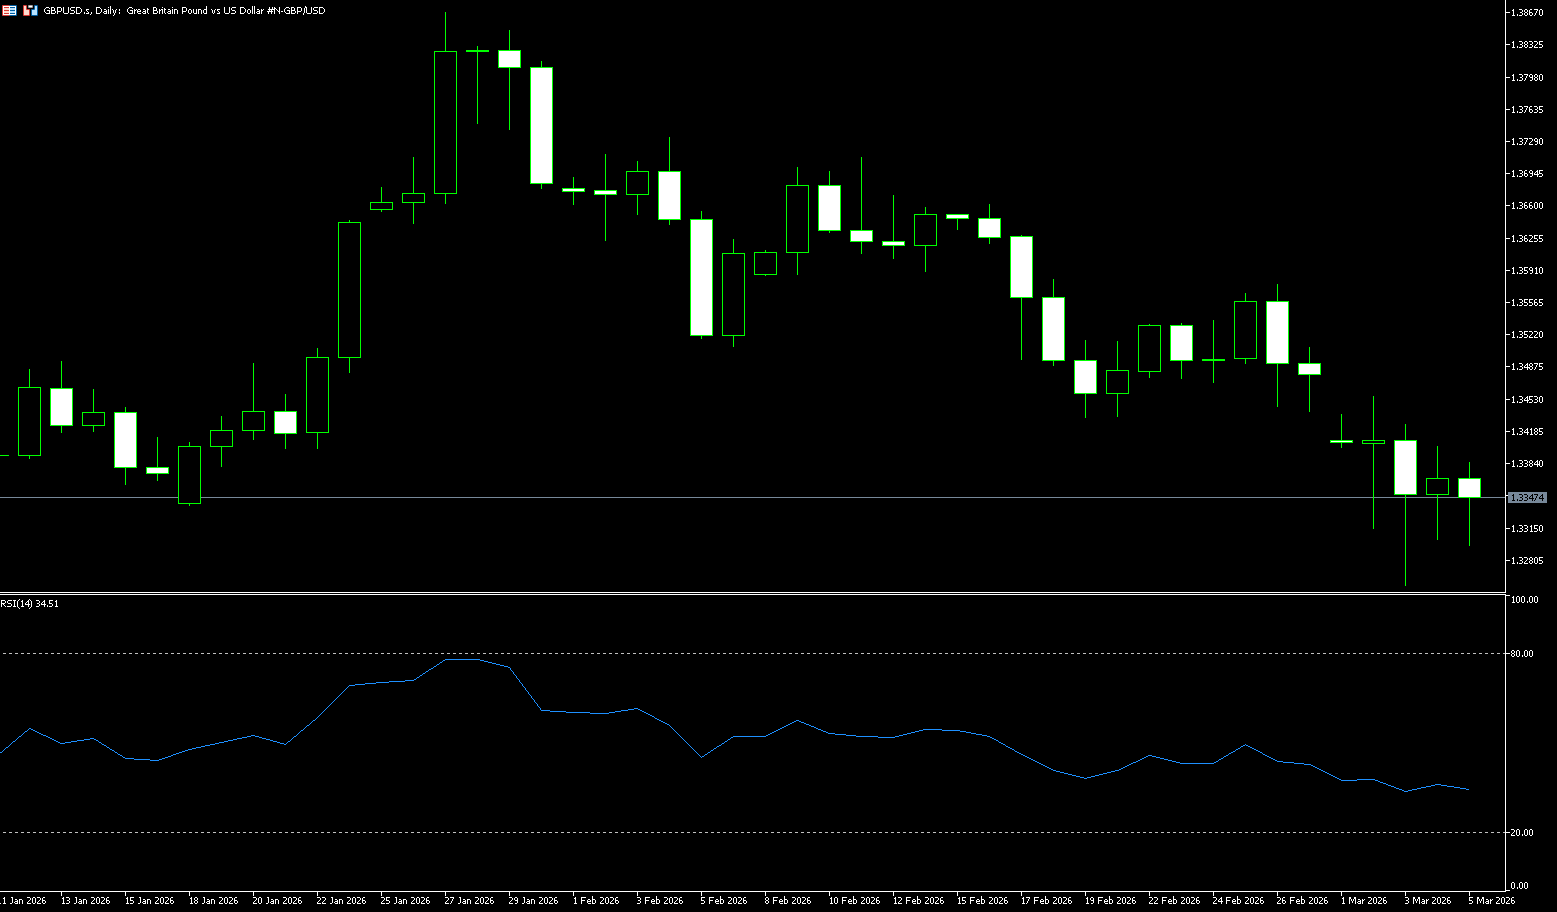
The pound rose to $1.3340, recovering some of the losses that pushed it to near three-month lows earlier, as the dollar retreated after a report that Iran had offered to discuss terms to end the war. The New York Times reported that Iranian intelligence agents made indirect contact with the CIA a day after the start of the US-Israel attacks. However, Israeli officials have advised Washington to temporarily ignore the proposal. Investors also weighed the impact of rising energy costs on the Bank of England's policy. The market now sees only a 20% chance of a rate cut this month, down from 75% last week, and only expects a 25 basis point cut for the year. Meanwhile, the Office for Budget Responsibility lowered its 2026 UK growth forecast to 1.1% from 1.4% in November, but expects stronger growth of 1.6% in 2027 and 2028, even without considering the energy shock, while also reducing borrowing and inflation expectations.
The dollar rose to its highest level in over a week, becoming another factor putting downward pressure on GBP/USD. However, the dollar lacked confidence to rise amid dovish expectations for the Federal Reserve System. GBP/USD saw a technical rally mid-week to just below 1.3400. The GBP/USD pair has again found support near the 280-day simple moving average (1.3325) and the psychological level of 1.3300, which should now be a key pivot point for short-term traders. The MACD histogram remains negative, showing the MACD line below the signal line and near zero. The Relative Strength Index (RSI) is at 36 (neutral to bearish) after rebounding from earlier lows, suggesting that upward attempts may remain fragile. Furthermore, a break above 1.3400 (the psychological level) would confirm a deeper correction towards 1.3444 (the 200-day simple moving average) and 1.3456 (this week's high).
Consider shorting GBP/USD today near 1.3360; Stop loss: 1.3370, Target: 1.3310; 1.3300
USD/JPY
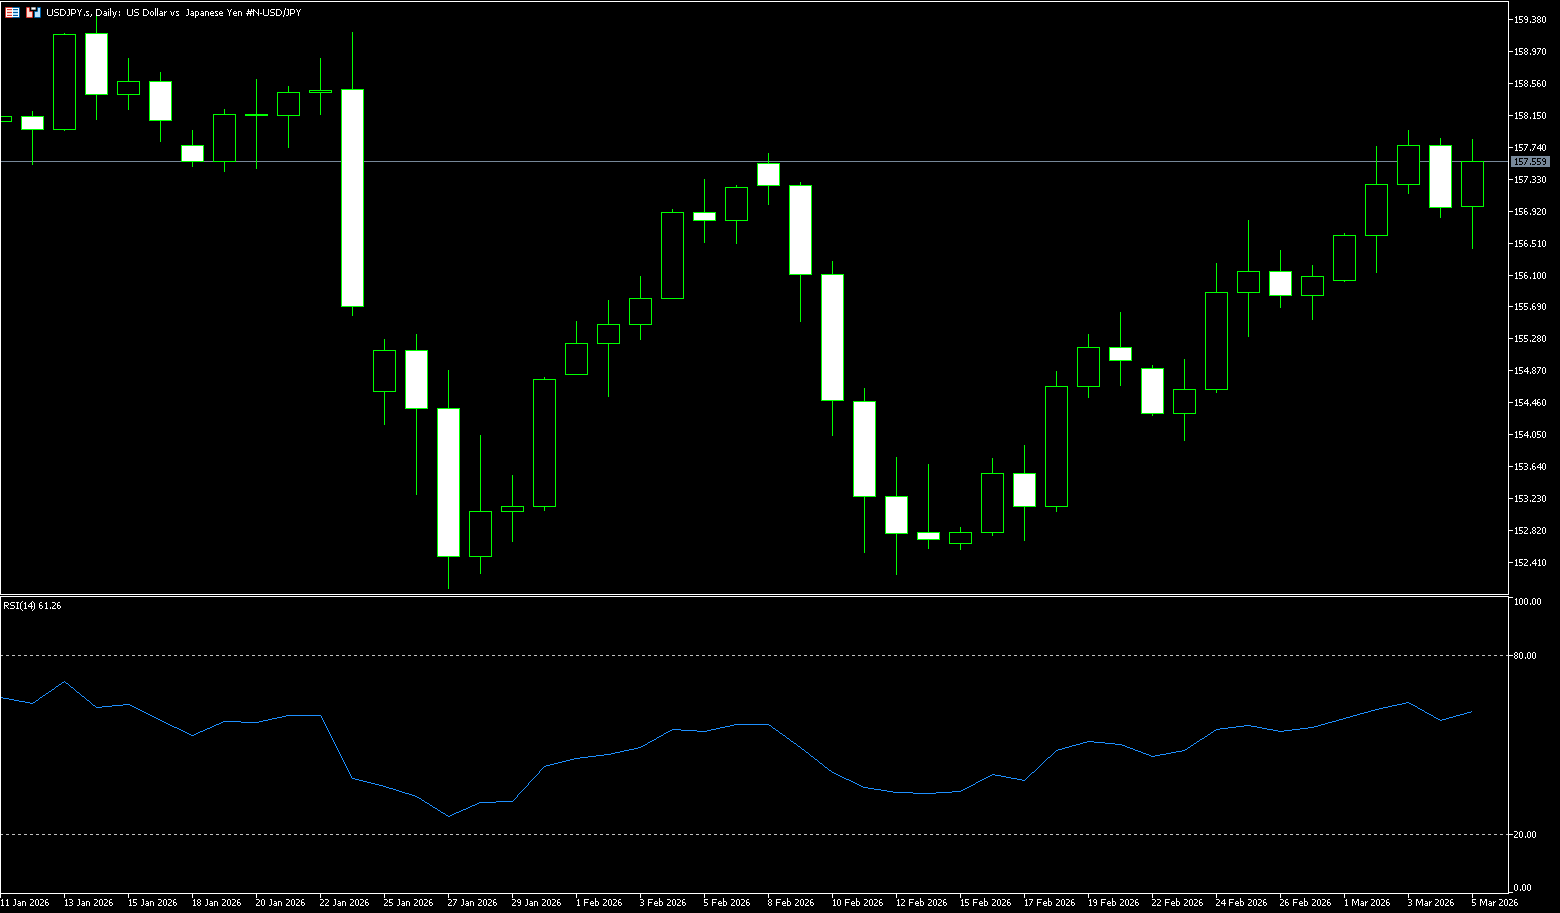
USD/JPY held its pullback from year-to-date highs on Thursday, remaining near 157.50. Concerns about intervention, coupled with market expectations that the Bank of Japan will stick to its policy normalization path, supported the yen and put pressure on the pair amid a weaker US dollar. However, geopolitical tensions could benefit the dollar's reserve currency status as market bets on more aggressive easing by the Federal Reserve decrease, thus providing support for the pair. Meanwhile, the US dollar is clearly leading among safe-haven currencies as the US-Israel conflict enters its fifth day. Japanese Finance Minister Satsuki Katayama stated that currency market intervention remains an option to support the yen, noting that authorities are monitoring the decline "with a strong sense of urgency" and coordinating closely with the US. Elsewhere, Bank of Japan Governor Kazuo Ueda warned that the Middle East conflict could significantly impact the Japanese economy, suggesting the central bank may maintain stable interest rates for an extended period.
The daily chart shows that the USD/JPY pair has recently shown a significant upward trend, rising from around 152.22 (the low of February 12th) to a weekly high of 157.97, clearly breaking through the Bollinger Bands midline of 155.30. The MACD indicator remains bullish and has formed a golden cross, with the MACD histogram showing positive and expanding values, indicating that momentum is still accumulating. Currently, the exchange rate is hovering around 157.00, facing short-term downward pressure from profit-taking. The initial targets are at 156.09 (50-day moving average) and the 156.00 (psychological level), with a break above targeting 155.31 (20-day moving average). However, looking at a longer timeframe, this breakout has brought the price into a higher range, and a break above the Bollinger Band often signifies initial confirmation of a trend continuation. The initial targets are at 157.97 (this week's high) and the 158.00 (psychological level), with further targets at the January 14 high of 159.45.
Consider shorting the US dollar near 157.80 today; Stop loss: 157.95; Target: 156.60; 156.50
EUR/USD
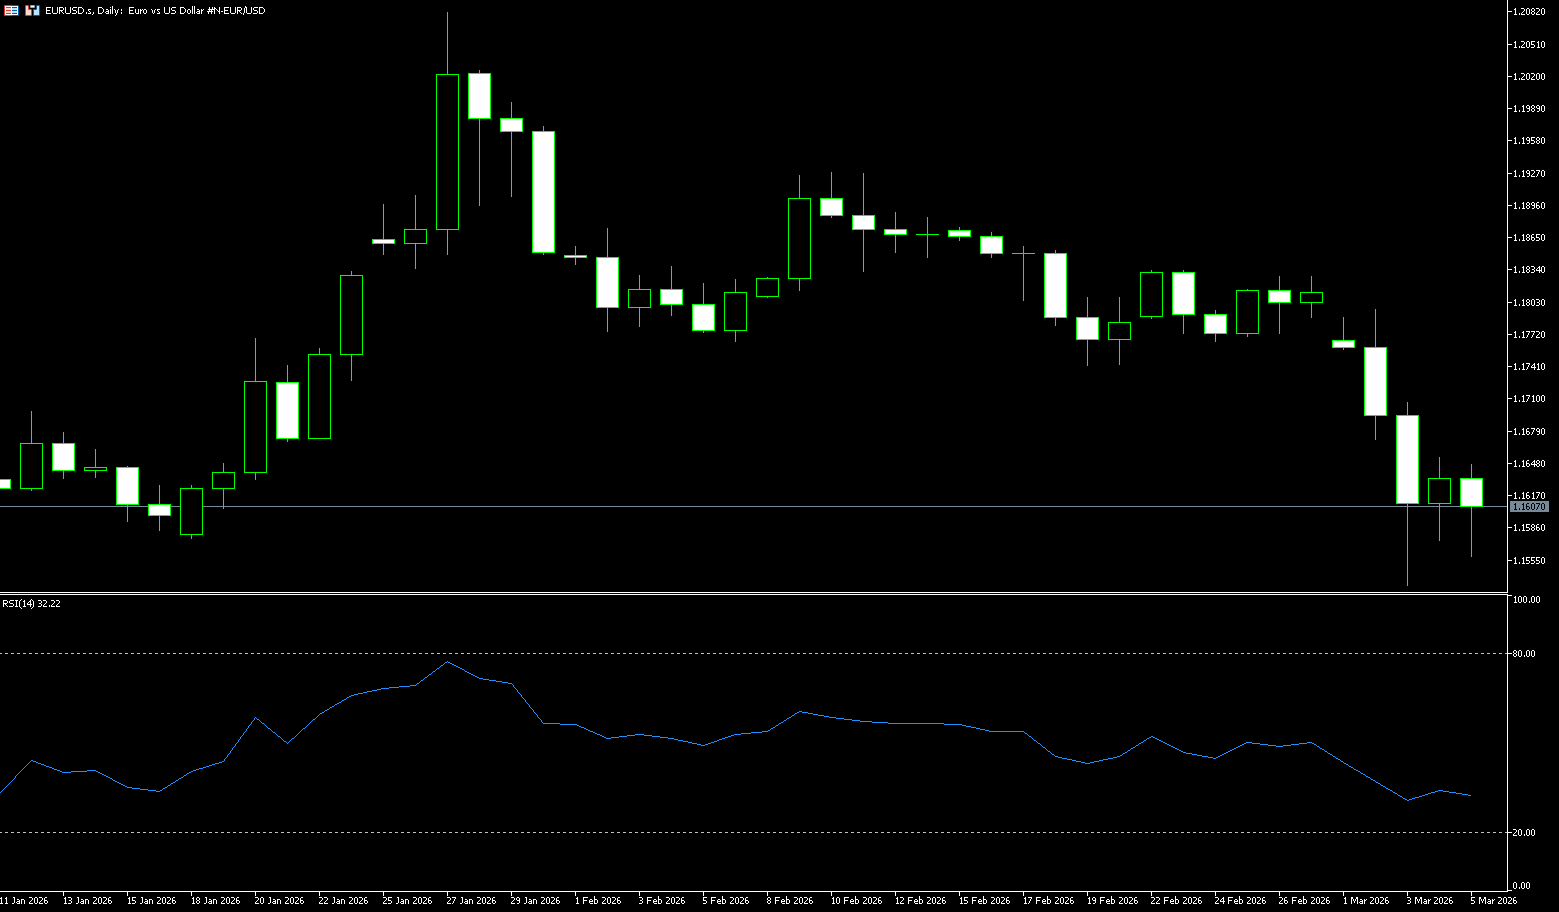
On Thursday morning, EUR/USD traded near 1.1610, in negative territory. The escalating conflict in the Middle East strengthened the dollar against the euro, driving safe-haven inflows. The conflict between the US, Israel, and Iran has entered its sixth day. The Israeli military said Wednesday it had begun a new round of strikes against military infrastructure in Tehran, while the chairman of the Joint Chiefs of Staff said the U.S. would begin a “gradual and in-depth” strike against Iran. Escalating geopolitical tensions triggered a “risk-averse” rush by traders, supporting the dollar and creating headwinds for major currency pairs. New inflation concerns, fueled by soaring oil and gas prices due to the Middle East conflict, prompted traders to make some bets on a European Central Bank rate hike this year. This, in turn, could boost the euro against the dollar.
On the daily chart, EUR/USD is trading at 1.1610. The short-term bias is slightly bearish, as the spot has broken below the rising 50-day and 100-day simple moving averages, which now limit the price range between 1.1677 and 1.1697, while the rising 200-day simple moving average near 1.1672 highlights a deeper but still intact broader uptrend. The 14-day Relative Strength Index (RSI) remains near 32, indicating continued downward momentum after the recent decline. Immediate resistance is located at the 1.1697 (1000-day simple moving average) and the 1.1700 (psychological level) area. A daily close above this area would alleviate selling pressure and open the way to 1.1800. On the downside, initial support is at 1.1571 (250-day simple moving average). A break below this level would expose support at the 1.1500 level.
Consider shorting the Euro today near 1.1620; Stop loss: 1.1630; Targets: 1.1570, 1.1580
Disclaimer: The information contained herein (1) is proprietary to BCR and/or its content providers; (2) may not be copied or distributed; (3) is not warranted to be accurate, complete or timely; and, (4) does not constitute advice or a recommendation by BCR or its content providers in respect of the investment in financial instruments. Neither BCR or its content providers are responsible for any damages or losses arising from any use of this information. Past performance is no guarantee of future results.
More Coverage


Risk Disclosure:Derivatives are traded over-the-counter on margin, which means they carry a high level of risk and there is a possibility you could lose all of your investment. These products are not suitable for all investors. Please ensure you fully understand the risks and carefully consider your financial situation and trading experience before trading. Seek independent financial advice if necessary before opening an account with BCR.
BCR Co Pty Ltd (Company No. 1975046) is a company incorporated under the laws of the British Virgin Islands, with its registered office at Trident Chambers, Wickham’s Cay 1, Road Town, Tortola, British Virgin Islands, and is licensed and regulated by the British Virgin Islands Financial Services Commission under License No. SIBA/L/19/1122.
Open Bridge Limited (Company No. 16701394) is a company incorporated under the Companies Act 2006 and registered in England and Wales, with its registered address at Kemp House, 160 City Road, London, City Road, London, England, EC1V 2NX. This entity acts solely as a payment processor and does not provide any trading or investment services.

 English
 简体中文
简体中文
 繁體中文
繁體中文
 Bahasa
Melayu
Bahasa
Melayu
 Tiếng
Việt
Tiếng
Việt
 ไทย
ไทย
 日本語
日本語
 한국어
한국어
 ភាសាខ្មែរ
 español