


0
US Dollar Index
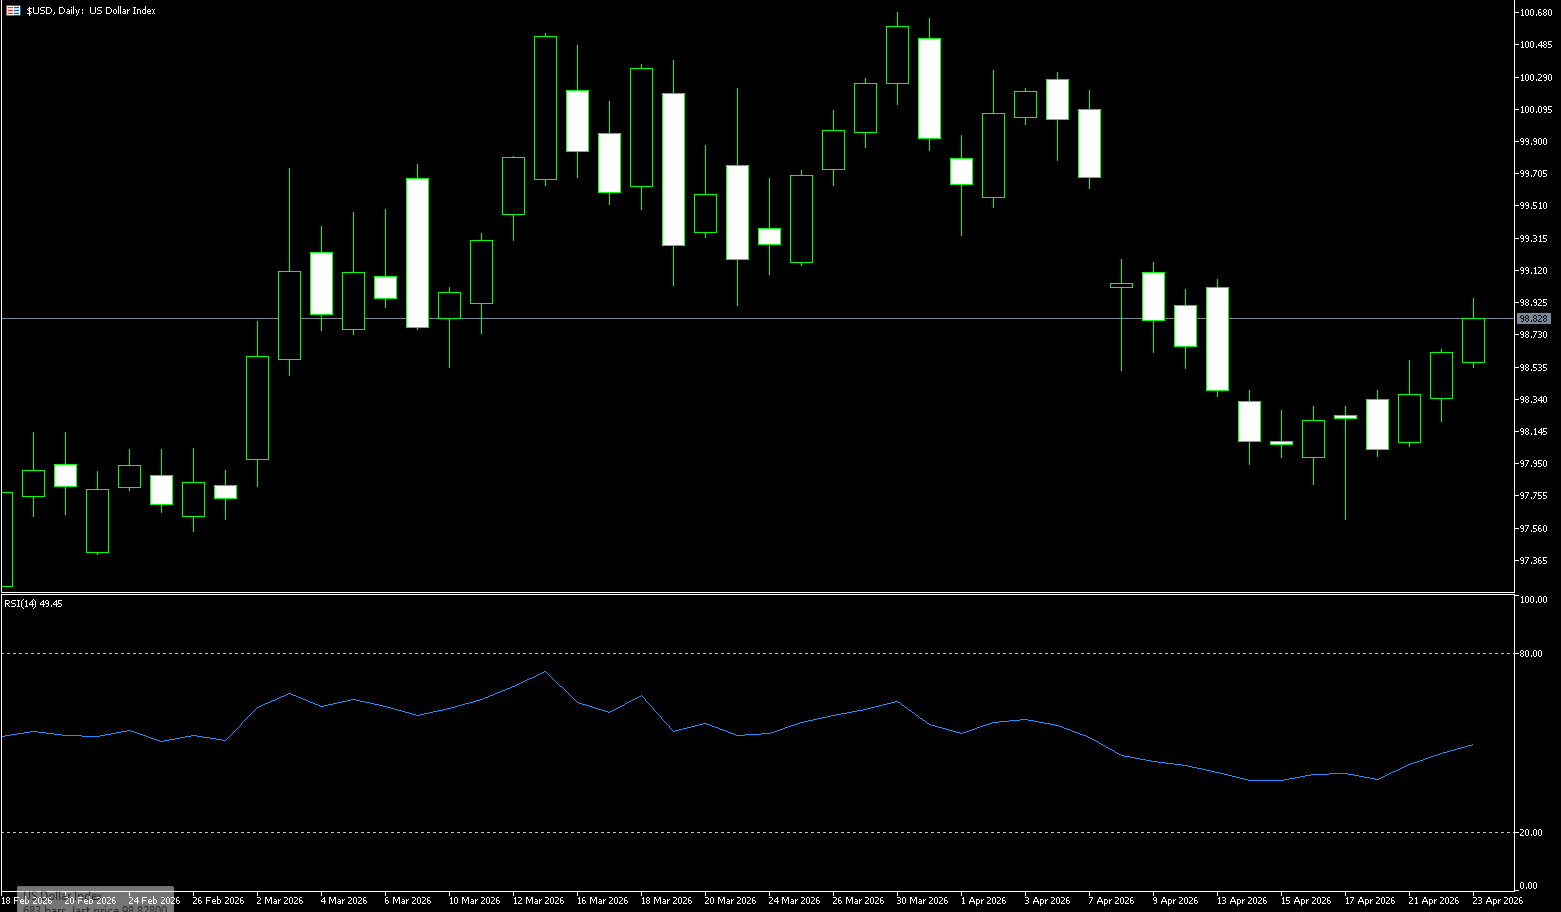
The US dollar index rose 0.38% midweek to 98.75, having earlier hit a seven-day high of 98.64. The index remained firm around 98.60, with investors continuing to favor the dollar amid ongoing uncertainty surrounding the US-Iran conflict. Despite President Trump's extension of the ceasefire agreement, Iran's seizure of two ships in the Strait of Hormuz kept traders cautious and reinforced a defensive market sentiment. While President Trump indefinitely extended the ceasefire to give Tehran more time to propose a unification plan, Iran's seizure of two ships in the Strait of Hormuz further escalated tensions, causing market sentiment to oscillate between expectations of peace and a protracted conflict. Both sides seem more inclined towards progress than further escalation. Regarding interest rates, market expectations for a Federal Reserve rate cut this year are low due to the potential for war to push up inflation; federal funds futures indicate a 28% probability of only one rate cut by the end of 2026.
After its mid-April dip, the US dollar index has shown strong resilience, currently trading around 98.65. The price has successfully held above the 200-day moving average of 98.53 and is attempting to break through the 99 level. The continued expansion of the MACD's red histogram indicates that the short-term technical rebound momentum has not yet weakened. However, further upside for the dollar faces the offsetting effect of a decline in geopolitical premiums. The indefinite extension of the ceasefire agreement in the relevant regions has weakened the dollar's absolute appeal as a single safe-haven asset. Furthermore, the debate surrounding "tariff rhetoric" has not yet entered a substantial phase, leaving the market largely in a wait-and-see period. In the short term, the dollar index's resistance zone is locked between 99.16 (April 19 high) and 99.00 (psychological level). If it fails to break through with significant volume, profit-taking may occur. The support zone below is seen at Wednesday's low of 98.21 to the 98.00 level. It is expected that the dollar will maintain a slightly bullish trend over the next two days, but the slope will slow down.
Today, consider shorting the US Dollar Index at 98.94, with a stop-loss at 99.05 and targets at 98.50 and 98.40.
WTI Crude Oil
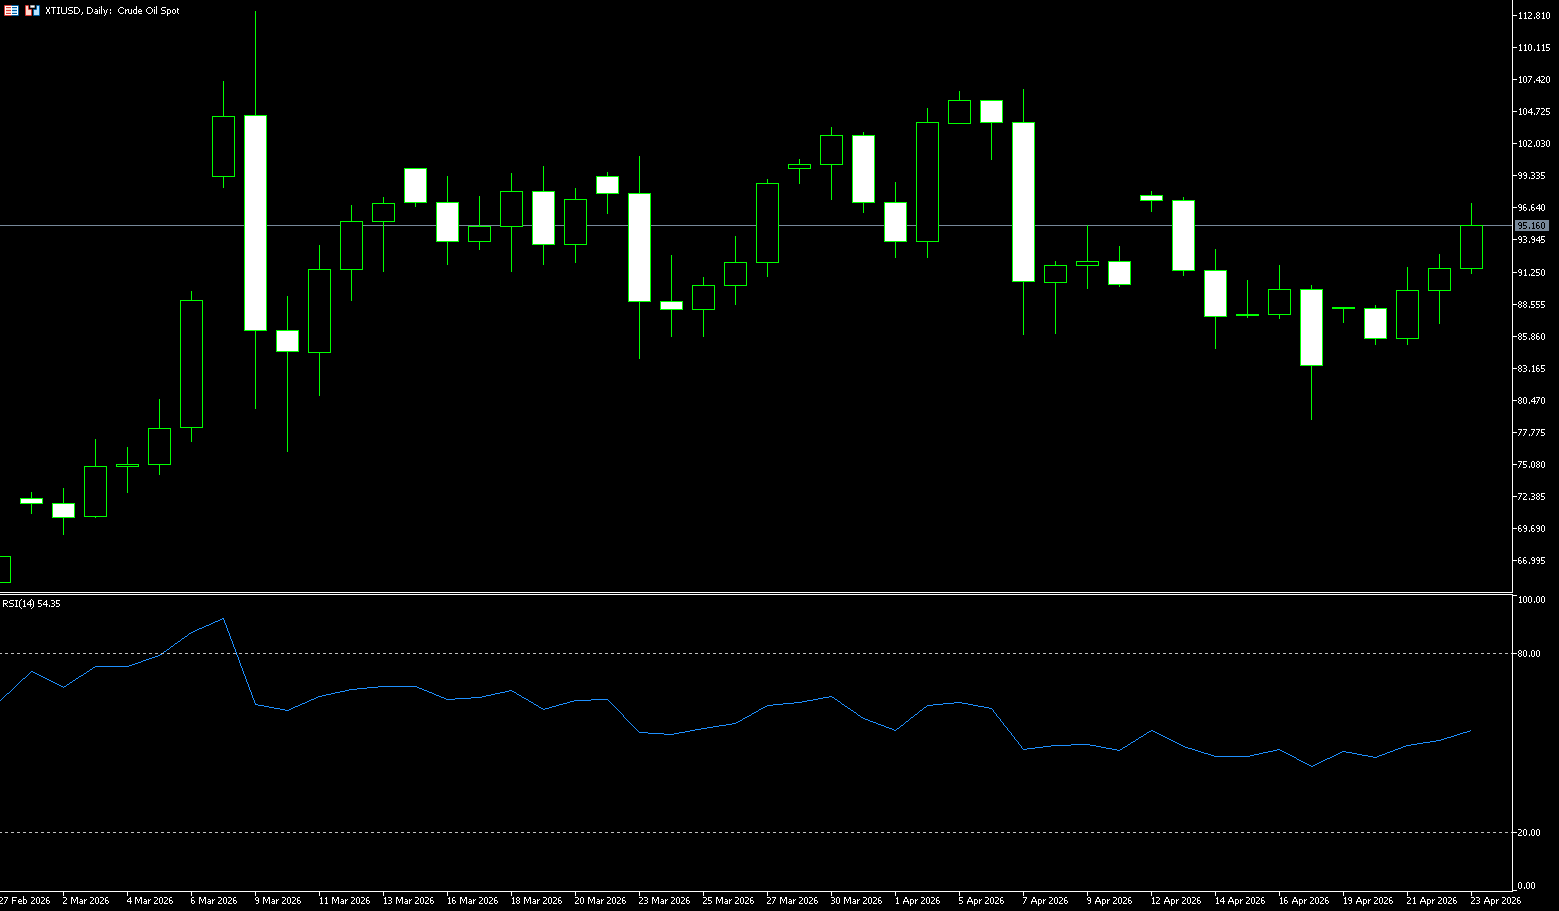
WTI crude oil rose above $95.70 per barrel on Thursday, marking its fourth consecutive day of gains, as diplomatic efforts between the US and Iran made limited progress and reports surfaced that the US had intercepted at least three Iranian oil tankers in Asian waters. Tehran also continued to claim control of the Strait of Hormuz, restricting almost all international navigation, and reportedly fired on commercial vessels this week. Meanwhile, the US maintained its blockade of Iranian ports to increase pressure on the Islamic Republic. At the same time, President Trump stated that the current ceasefire would remain indefinitely as Washington awaits a revised peace proposal from Iran, although Tehran has indicated it does not intend to negotiate in the near future. On the supply side, EIA data showed a decline in US key refined product inventories, indicating strong demand in both domestic consumption and export markets.
The WTI crude oil market is currently in a period of technical correction and fundamental restructuring following extreme volatility. On the one hand, sudden changes in the geopolitical situation disrupted the fragile balance, causing risk premiums to quickly return to normal levels. On the other hand, dynamic changes in US energy inventory data provided solid endogenous momentum for prices. Currently, both sides are still exerting pressure on each other to increase their bargaining chips. The geopolitical drama ultimately paves the way for negotiations. However, oil prices, constrained by physical shortages and the passive depletion of global inventories, still have a need for a rebound. The market is currently awaiting further developments in the narrative from the US regarding a unified negotiating stance within Iran. From a technical perspective, $98.15 (April 13th) and the psychological level of $97 constitute key resistance levels. If the bulls cannot effectively break through these levels in the short term, the upside potential will be limited. On the downside, $90 forms a short-term support level. If this level is breached, a further decline to the key support area of $87.02 (45-day moving average) could occur.
Today, consider going long on crude oil at 95.50, with a stop loss at 95.30 and targets at 97.00 and 98.00.
Spot Gold
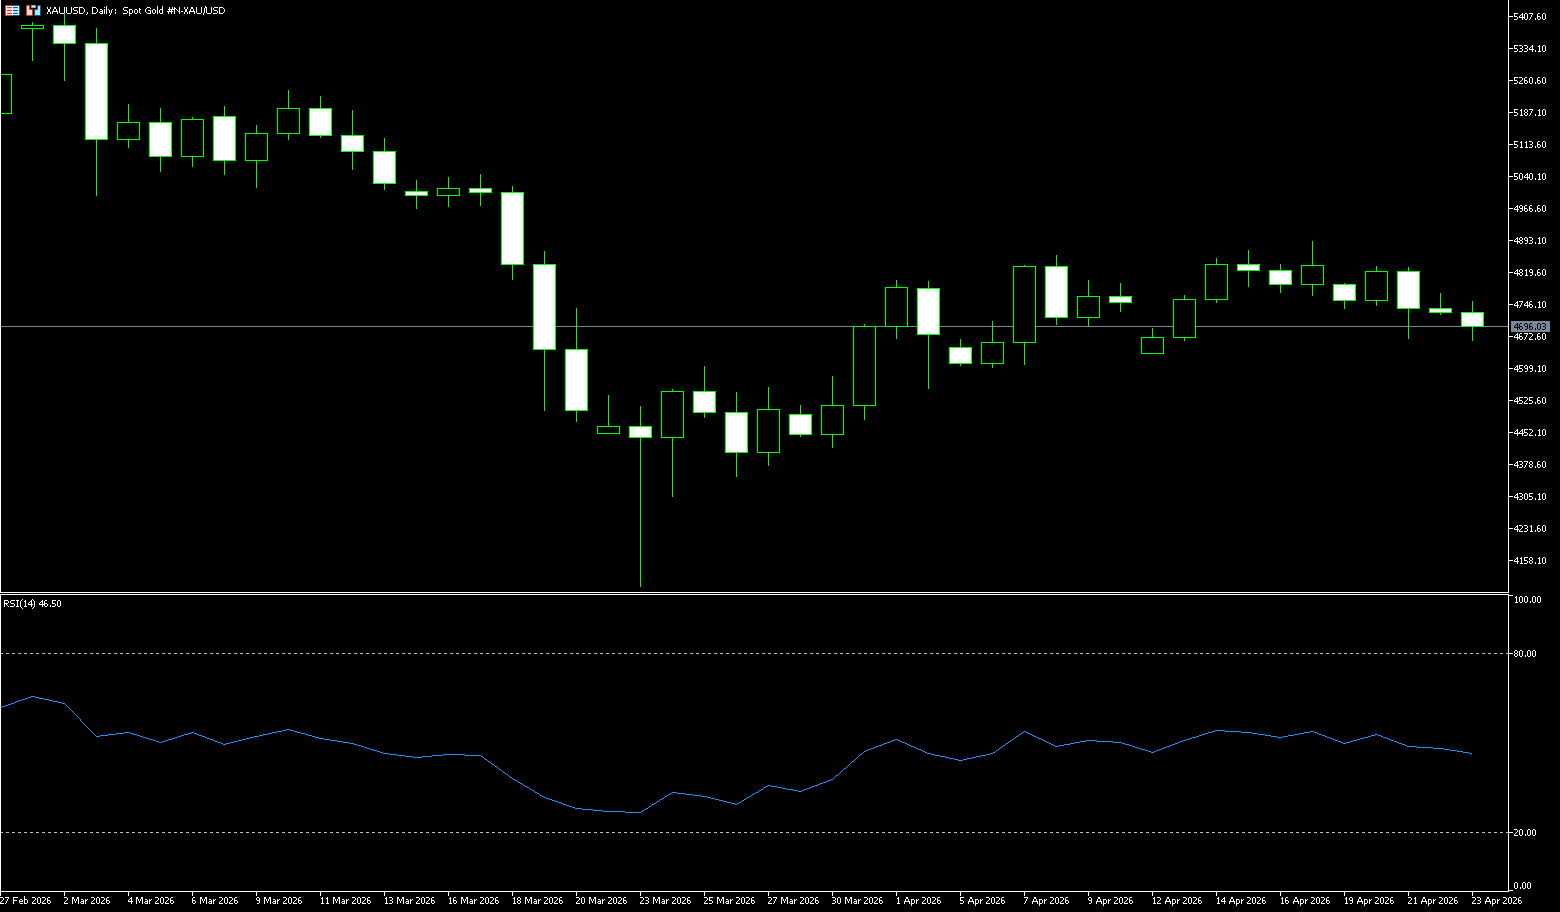
In early European trading on Thursday, spot gold traded around $4,700 per ounce. It may test the $4,700 level during the day. Uncertainty remains regarding the resumption of US-Iran peace talks. Federal Reserve Chairman nominee Warsh stated that he had not committed to interest rate cuts to Trump, limiting gold price gains. The previous trading day saw gold record its largest single-day drop since March 26th, with analysts pointing to bargain hunting following Tuesday's decline. Geopolitically, Iran seized two ships in the Strait of Hormuz, while US President Trump stated that the US blockade against Iran would continue. An informed source revealed that he has not yet set a timetable for a ceasefire, and there are currently no signs of resuming peace talks. Meanwhile, the Israeli drone attack on Lebanon also put pressure on the ceasefire agreement. Although gold is considered an inflation hedge, rising interest rates have dampened demand for this non-yielding metal. Furthermore, Federal Reserve Chairman nominee Warsh stated that he had not committed to interest rate cuts to Trump and emphasized that he would act independently.
Although gold prices recorded their biggest single-day drop since March 26th on Tuesday, bargain hunting provided some upward momentum, with significant buying activity appearing in the gold market. However, the dual pressure of inflation and interest rates from rising oil prices, along with the strong rebound of the US dollar, constituted a stronger downward pressure. Gold is currently still in a downward channel since the outbreak of the war and is unlikely to break out of the 4,632 (120-day moving average) - 4,800 (psychological level) range in the short term. Currently, gold prices are in a special window where "geopolitical benefits are offset by macroeconomic negatives." If the conflict escalates further and oil prices spiral out of control, gold prices will likely face even stronger policy tightening pressure, and may even test the support level near 4,600 in the coming week. Support levels to watch are the 4,600 (psychological level) and Tuesday's low in the 4,668 range. Watch for resistance at 4,780 (35-day moving average) and 4,800 USD (psychological level).
Consider going long on spot gold today at 4,694, with a stop loss at 4,690 and targets at 4,750 and 4,760.
AUD/USD
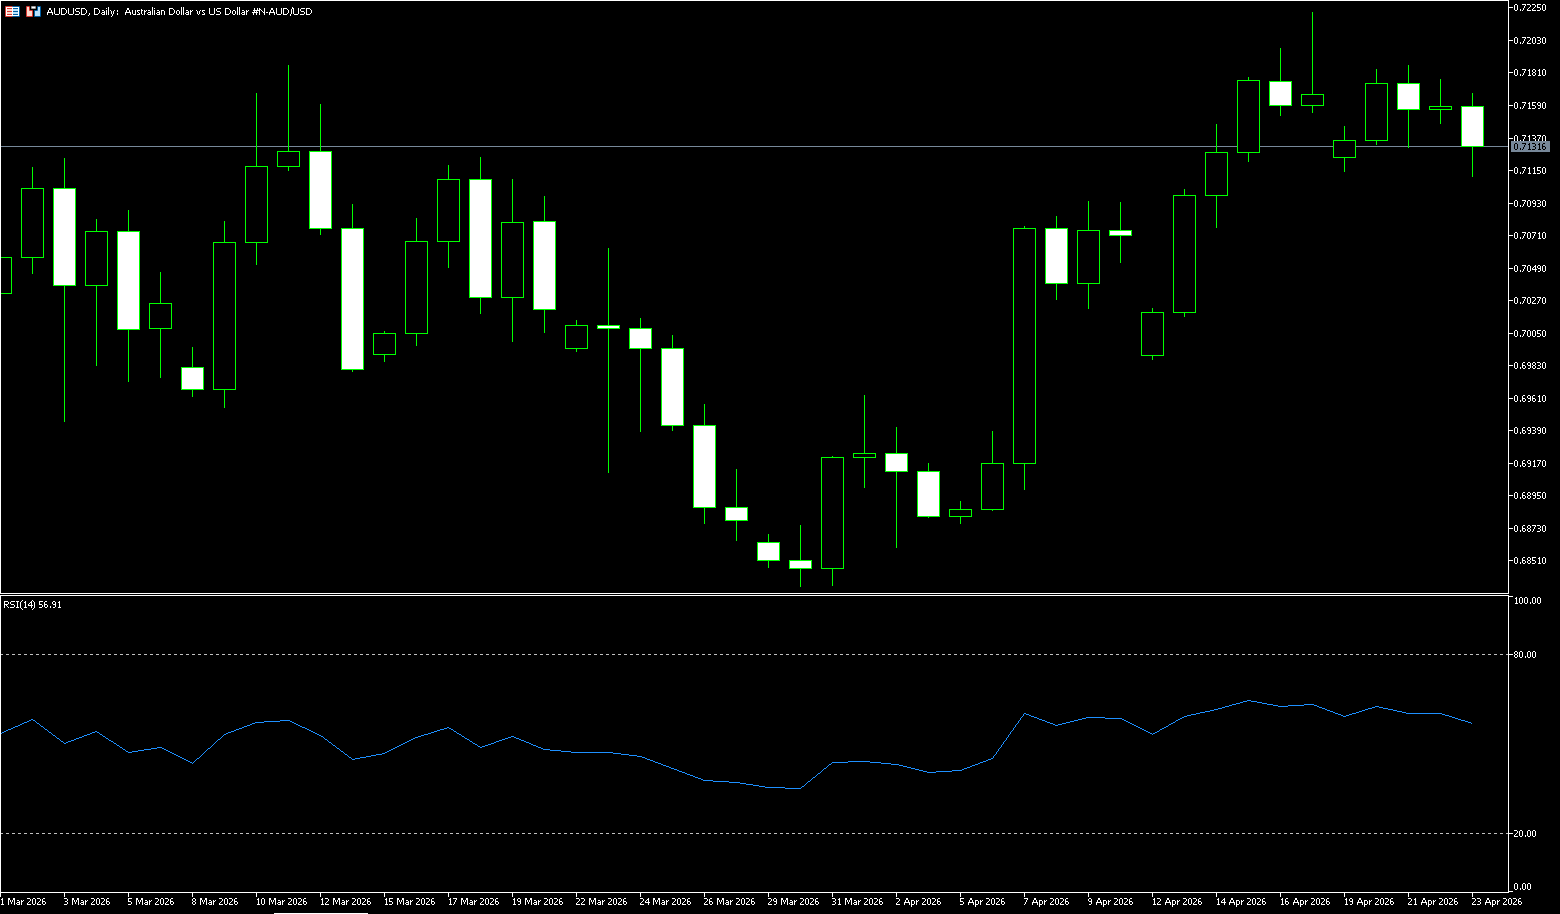
The AUD/USD pair gained momentum around 0.7130 in early Asian trading on Thursday. US President Trump's extension of the ceasefire agreement with Iran boosted risk appetite and supported the Australian dollar against the US dollar. The preliminary S&P Global Purchasing Managers Index will be released later on Thursday. President Trump said on Tuesday that the US was extending the ceasefire agreement with Iran at Pakistan's request, while awaiting a unified proposal from Iran. This development eased concerns about a possible renewed conflict, which had previously driven a sharp rise in energy prices. However, tensions remain high, with Tehran maintaining tight control over the Strait of Hormuz, controlling the passage through this trade route and firing on ships. Signs of ongoing conflict in the Middle East could boost safe-haven currencies like the US dollar and put resistance on this currency pair.
On the daily chart, the Australian dollar is trading around 0.7130 against the US dollar. The price maintains a short-term bullish bias as the spot price remains above the 14-day simple moving average at 0.7102 and the psychological level of 0.7100. The pair continues its upward trend from the lows of late March, and the rising simple moving averages indicate that fundamental demand is supporting a shallow pullback. The 14-day Relative Strength Index (RSI) is around 60, indicating strong momentum but not yet overbought, supporting further upside attempts. On the downside, initial support lies at the 14-day simple moving average at 0.7102 and the psychological level of 0.7100. A sustained break below this level would suggest weakening bullish pressure and could trigger a deeper correction towards the psychological level of 0.7000. As long as buyers hold this moving average at the close of the day, the overall constructive structure is likely to persist, and even with a short-term consolidation phase, the pair is still biased towards testing higher levels. On the upside, the pair is expected to extend its upward trend to 0.7197 (April 16 high) and move towards the multi-year high of 0.7300.
Consider going long on the Australian dollar today at 0.7118, with a stop-loss at 0.7110 and targets at 0.7170 and 0.7180.
GBP/USD
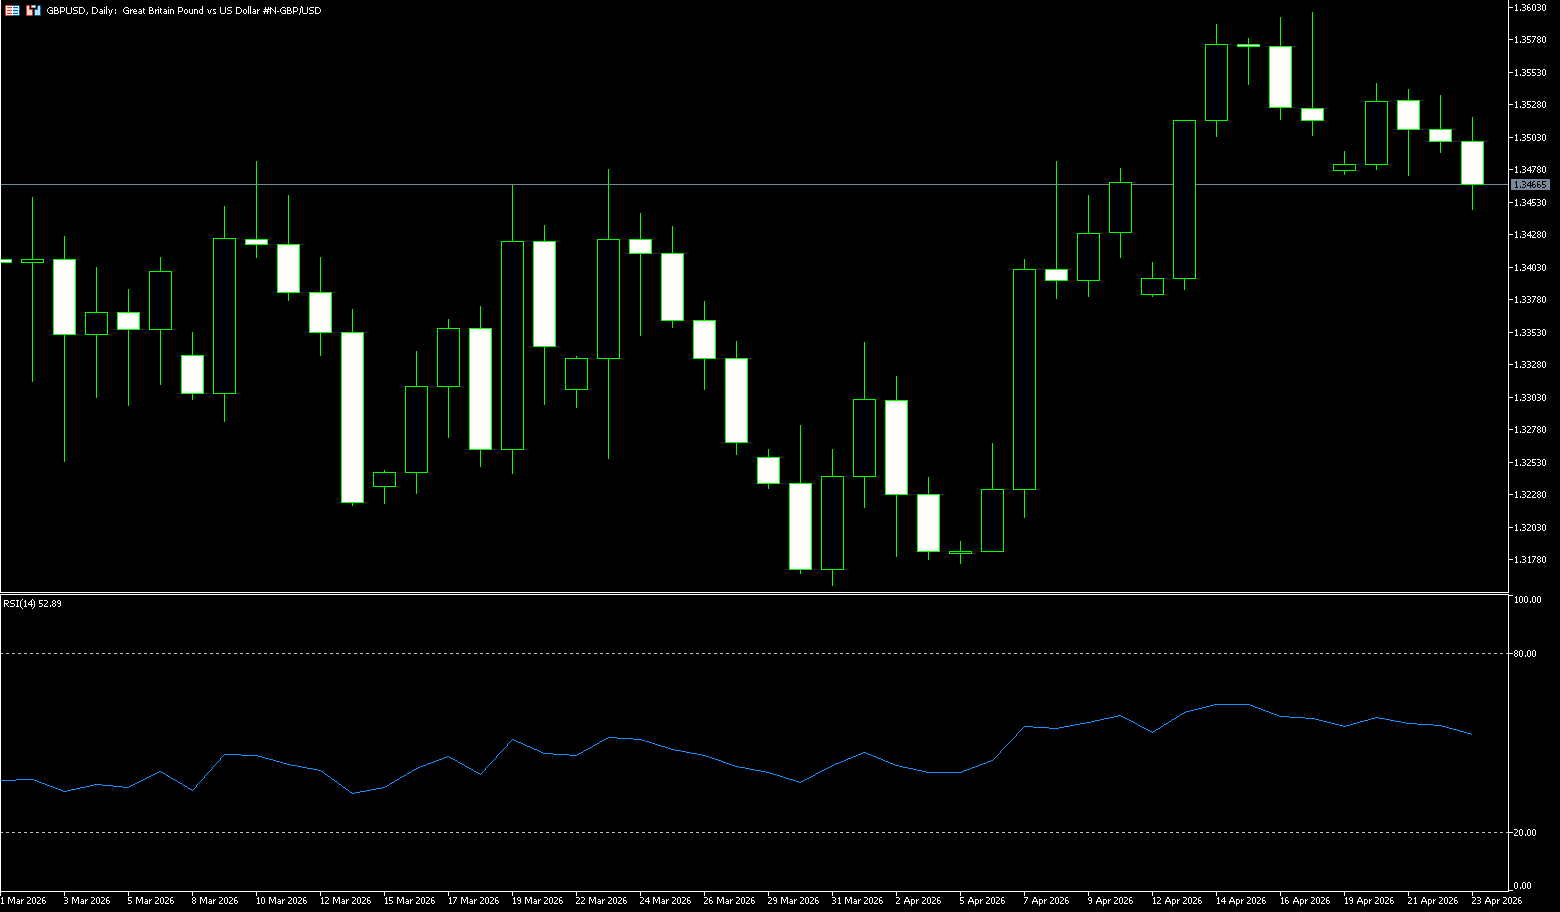
The GBP/USD pair weakened for the third consecutive day, trading around 1.3470 on Thursday. The Middle East conflict disrupted energy transport routes, causing a sharp rise in global oil and gas prices, putting the UK, as a net energy importer, under direct imported inflationary pressure. The sharp rise in petrol and diesel prices in March not only increased transportation costs for consumers but also passed on to producers in the manufacturing and service sectors through the supply chain. The sharp jump in producer input prices indicates that cost pressures are spreading from upstream to downstream, although the current transmission speed is still constrained by weak demand. The Bank of England had previously projected April inflation to be close to its target level, but persistently high energy prices have forced an upward revision, potentially reaching 3.5% by mid-year. Market sentiment is currently cautious, with investors adopting a wait-and-see approach. Ahead of key data releases, both bulls and bears lack sufficient confidence to drive a trend continuation, keeping the exchange rate within a range.
Technical analysis on the daily chart suggests a potential bearish reversal as the pair breaks below its ascending channel pattern. However, GBP/USD maintains a constructive bullish bias, as it is slightly above the 9-period simple moving average and firmly above the 50-period moving average. The 14-day Relative Strength Index (RSI) is around 56, indicating positive but not excessive momentum, allowing for further upside potential during pullbacks. A return to the ascending channel would see GBP/USD test the initial resistance level of 1.3599, the two-month high reached on April 17th. Further gains would push the pair towards the psychological level of 1.3600. On the downside, GBP/USD is testing recent support at the 50-day simple moving average of 1.3414, followed by the psychological level of 1.3400.
Consider going long GBP at 1.3450 today, with a stop loss at 1.3440 and targets at 1.3500 and 1.3510.
USD/JPY
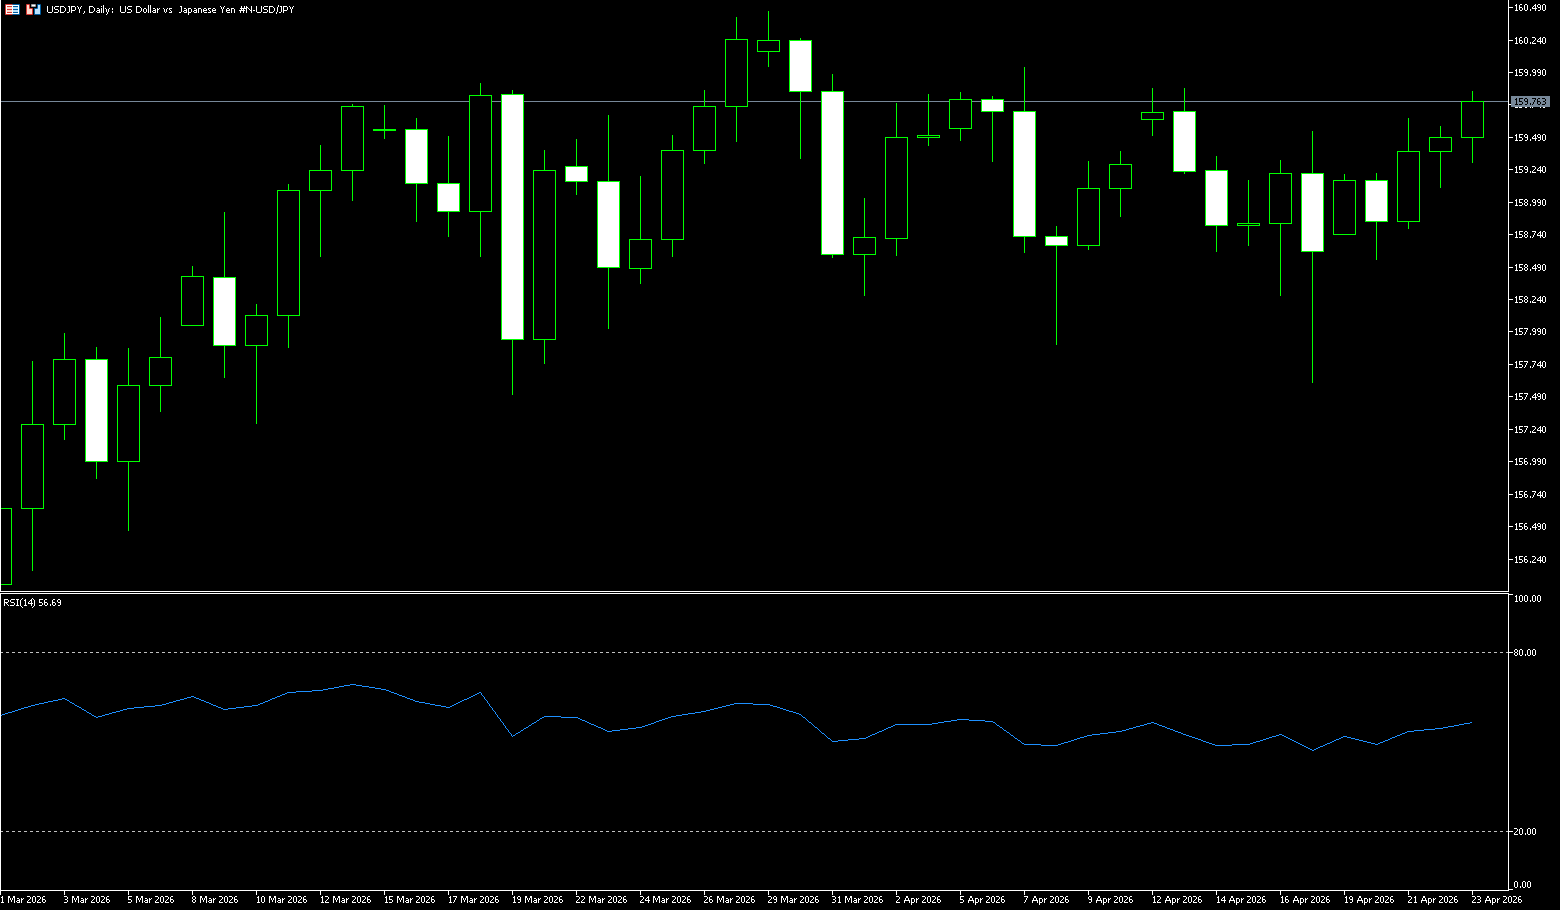
USD/JPY lost traction in Asian trading on Thursday, falling to around 159.60. US President Trump extended the ceasefire agreement with Iran, putting pressure on the USD/JPY. The preliminary S&P Global Purchasing Managers' Index (PMI) will be released later on Thursday. Trump said on Tuesday that he was extending the ceasefire agreement with Iran while awaiting a "unified proposal" from Tehran. Despite the extended ceasefire, Iran vowed not to reopen the Strait of Hormuz under US naval blockade. Meanwhile, Lebanon will push for a one-month extension of its current ceasefire agreement with Israel at a new round of meetings in Washington on Thursday. The talks between Lebanon and Israel on April 14th marked the first such meeting in decades, after which the United States announced a 10-day ceasefire agreement, which expires on Sunday. Bank of Japan Governor Kazuo Ueda avoided hinting at an April rate hike, citing the "negative supply shock" from the war as causing high economic uncertainty. Financial markets currently widely expect the Bank of Japan to maintain stable interest rates until at least June 2026.
Overall, the USD/JPY pair is currently in a phase of "fundamental divergence + technical consolidation." The market is repeatedly weighing geopolitical risks, monetary policy expectations, and intervention risks, keeping the exchange rate in a high-level consolidation pattern. From a technical perspective, the daily chart shows that USD/JPY remains in a high-level range-bound structure, with the overall trend still bullish, but the upward momentum has clearly slowed. The psychological level of 160.00 and the previous high of 160.46 constitute key resistance levels, and repeated unsuccessful tests indicate heavy selling pressure above; while the 158.00 area forms strong support below. The moving average system remains bullish overall, but short-term moving averages are beginning to flatten, reflecting a consolidation phase. Currently, the exchange rate is trading within a sideways consolidation range, with narrowing highs and lows, exhibiting a typical oscillating structure. Short-term resistance levels are concentrated around 160.00 (psychological level) and 160.46 (previous high), while support levels are at 158.85 (40-day moving average) and the 157.60 (April 17 low) area.
Consider shorting the US dollar at 159.82 today, with a stop-loss at 160.00 and targets at 159.00 and 158.80.
EUR/USD
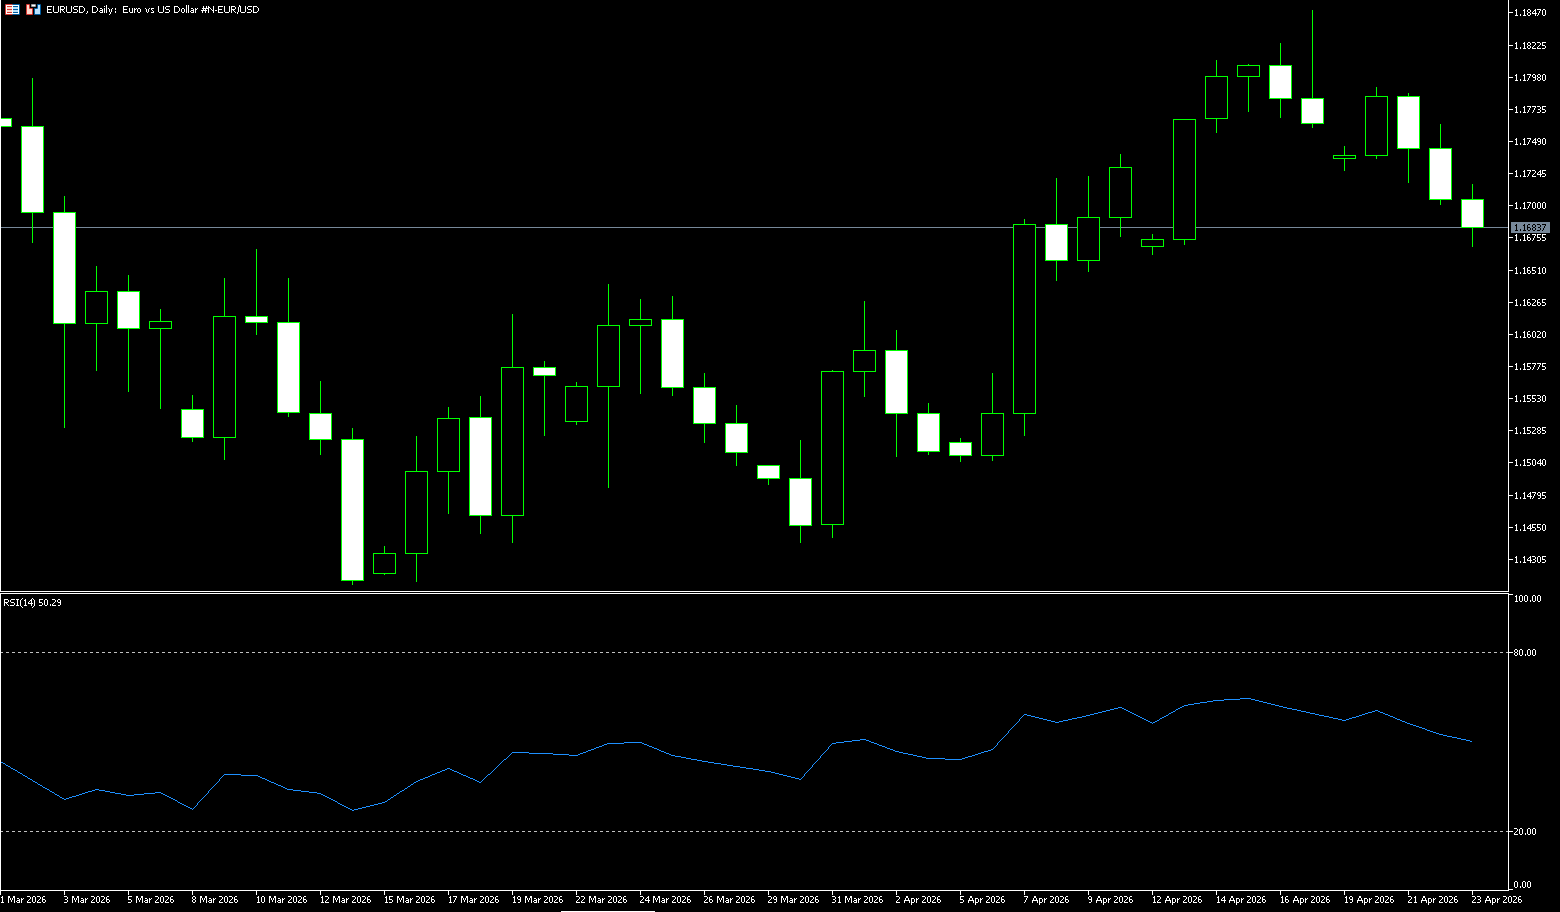
The euro/dollar pair consolidated around 1.1690 on Thursday. Risk appetite improved as US President Trump extended the ceasefire agreement with Iran, strengthening the euro against the dollar. Traders are preparing for the release of the preliminary S&P Global Purchasing Managers' Index (PMI) later in the day. The US extended its ceasefire agreement with Iran at Pakistan's request, pending a unified proposal from Iran. This move eased concerns about a renewed conflict, which had previously driven up energy prices and boosted the euro, a risk asset. Nevertheless, tensions remain high, with Tehran maintaining tight control of the Strait of Hormuz, controlling trade routes and firing on ships. Iran's chief negotiator and parliamentary speaker, Mohammad Bagher Ghalibaf, stated that Israel's war provocations and "blatant" violations of the ceasefire agreement have made reopening the Strait of Hormuz "impossible."
Recent UK inflation data has shown signs of energy cost transmission, and similar pressures in the Eurozone are expected to spread through supply chains. Traders should pay attention to subsequent communications from the European Central Bank; if it emphasizes data dependence, the euro may face additional downside risks. From a technical perspective, the euro/dollar pair is currently facing strong resistance around 1.1759 (the 9-day moving average) and the psychological level of 1.1800, having failed to break through multiple times in the short term. Intraday support lies around 1.1660 (50-day moving average) and the 1.1600 level. A break below these levels could open up further downside potential. Fundamentally, geopolitical risks are dominating, giving the US dollar a safe-haven appeal, and weak Eurozone data is expected to further pressure the exchange rate. Combined with the upcoming PMI data, if it shows weaker-than-expected economic activity, the euro/dollar pair may continue its range-bound, slightly weaker pattern. Overall, the current environment requires traders to monitor both oil price movements and geopolitical news; any breakout could trigger a trend reversal.
Consider going long on the euro today at 1.1675, with a stop-loss at 1.1665 and targets at 1.1730 and 1.1740.
Disclaimer: The information contained herein (1) is proprietary to BCR and/or its content providers; (2) may not be copied or distributed; (3) is not warranted to be accurate, complete or timely; and, (4) does not constitute advice or a recommendation by BCR or its content providers in respect of the investment in financial instruments. Neither BCR or its content providers are responsible for any damages or losses arising from any use of this information. Past performance is no guarantee of future results.
Lebih Liputan


Pendedahan Risiko:Instrumen derivatif diniagakan di luar bursa dengan margin, yang bermakna ia membawa tahap risiko yang tinggi dan terdapat kemungkinan anda boleh kehilangan seluruh pelaburan anda. Produk-produk ini tidak sesuai untuk semua pelabur. Pastikan anda memahami sepenuhnya risiko dan pertimbangkan dengan teliti keadaan kewangan dan pengalaman dagangan anda sebelum berdagang. Cari nasihat kewangan bebas jika perlu sebelum membuka akaun dengan BCR.
BCR Co Pty Ltd (No. Syarikat 1975046) ialah syarikat yang diperbadankan di bawah undang-undang British Virgin Islands, dengan pejabat berdaftar di Trident Chambers, Wickham’s Cay 1, Road Town, Tortola, British Virgin Islands, dan dilesenkan serta dikawal selia oleh Suruhanjaya Perkhidmatan Kewangan British Virgin Islands di bawah Lesen No. SIBA/L/19/1122.
Open Bridge Limited (No. Syarikat 16701394) ialah syarikat yang diperbadankan di bawah Akta Syarikat 2006 dan berdaftar di England dan Wales, dengan alamat berdaftar di Kemp House, 160 City Road, London, City Road, London, England, EC1V 2NX. Entiti ini bertindak semata-mata sebagai pemproses pembayaran dan tidak menyediakan sebarang perkhidmatan perdagangan atau pelaburan.

 English
 简体中文
简体中文
 繁體中文
繁體中文
 Bahasa
Melayu
Bahasa
Melayu
 Tiếng
Việt
Tiếng
Việt
 ไทย
ไทย
 日本語
日本語
 한국어
한국어
 ភាសាខ្មែរ
 español

