


0
US Dollar Index
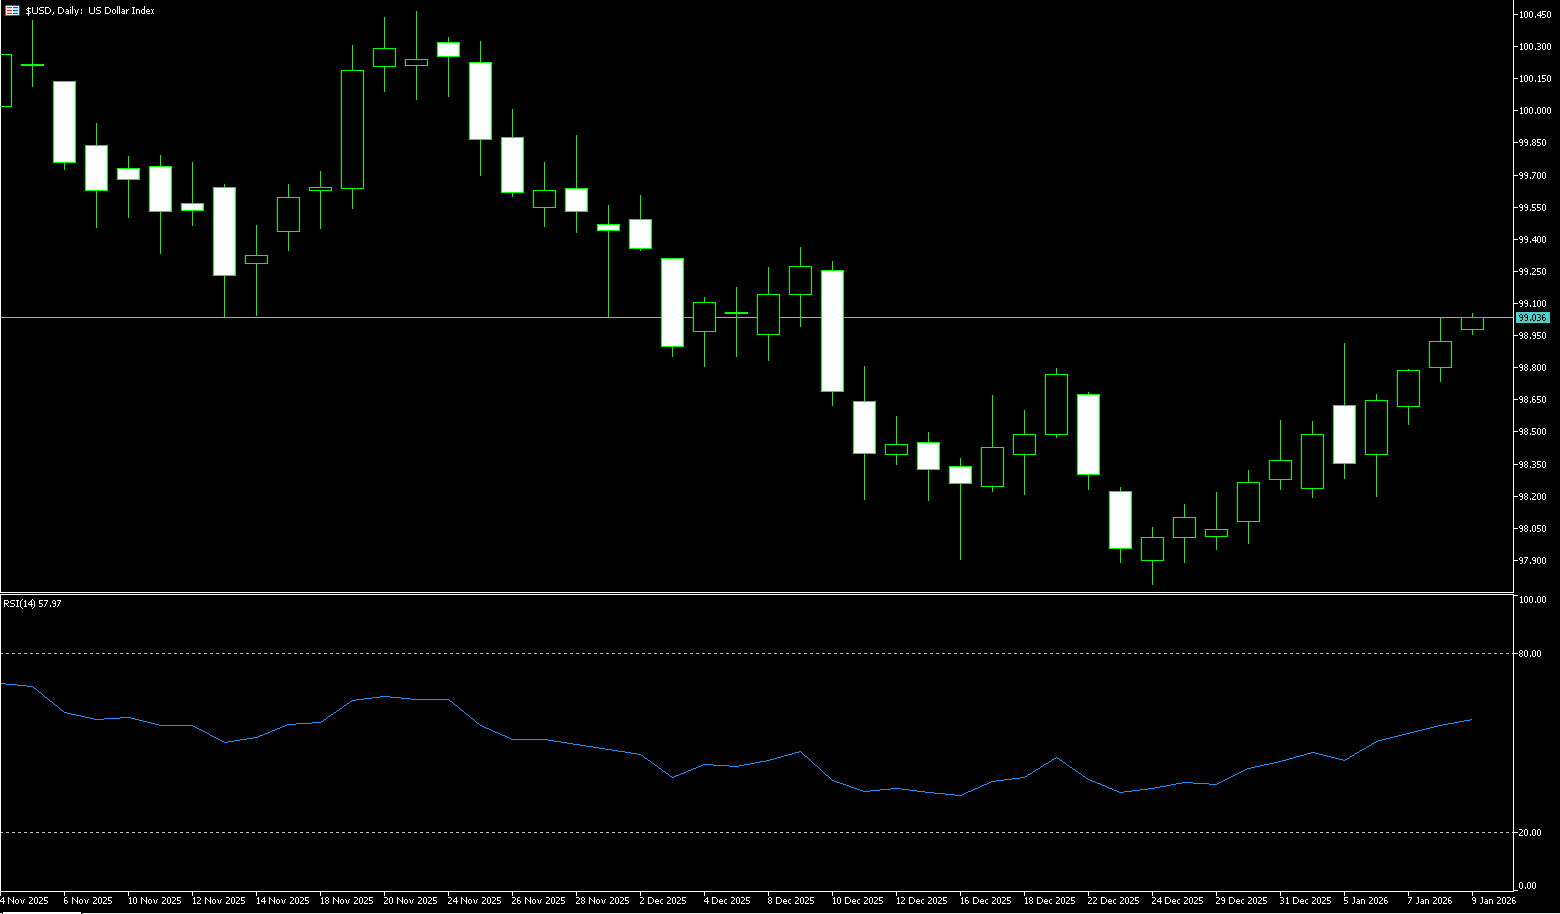
The US dollar strengthened on Friday as President Trump praised economic advisor Hassett and expressed his desire for him to remain in his current position. The market perceived a reduced likelihood of Hassett succeeding Powell as Federal Reserve Chairman, which fueled dollar buying. Strong US jobs data last week supported the dollar. At the start of this week, the dollar index dipped to around 99.00 before stabilizing. Former Fed Governor Walsh is currently considered the leading candidate for Fed Chairman. Hassett is seen by the market as the most dovish and least independent candidate, and his reduced likelihood supports the dollar. The dollar index is currently slightly above 99, exhibiting a rare "low-volatility upward movement + high-level consolidation" pattern in recent years. Unlike past sharp rises triggered by sudden events, this round of gains appears to be slowly pushed up by an unseen force. There has been no panic or large-scale chasing in the market, yet the dollar has steadily risen. The driving force behind this is not a single factor, but rather the result of the combined effects of macroeconomic fundamentals and capital flows.
In summary, whether the US dollar can continue its upward trend in the short term depends on two key factors: first, whether interest rate expectations continue to be revised slightly upward or at least not significantly downward; and second, whether overseas capital inflows and risk appetite can be sustained, while also paying attention to whether the hedging ratio increases, thereby weakening the marginal support for the dollar. From a technical chart perspective, the US dollar index once rose to 99.50 on the 4-hour chart before falling back, and is currently fluctuating narrowly around 99.10. The key resistance is located in the 99.50 area; if it can be effectively broken, it is expected to steadily advance towards the 100 mark. Conversely, if the important psychological level of 99 is lost, the short-term structure may turn into a correction, testing the 20-day moving average at 98.58, with further support at 98.00 (a psychological level).
Today, consider shorting the US Dollar Index around 99.16; Stop loss: 99.28; Target: 98.80; 98.70
WTI Crude Oil
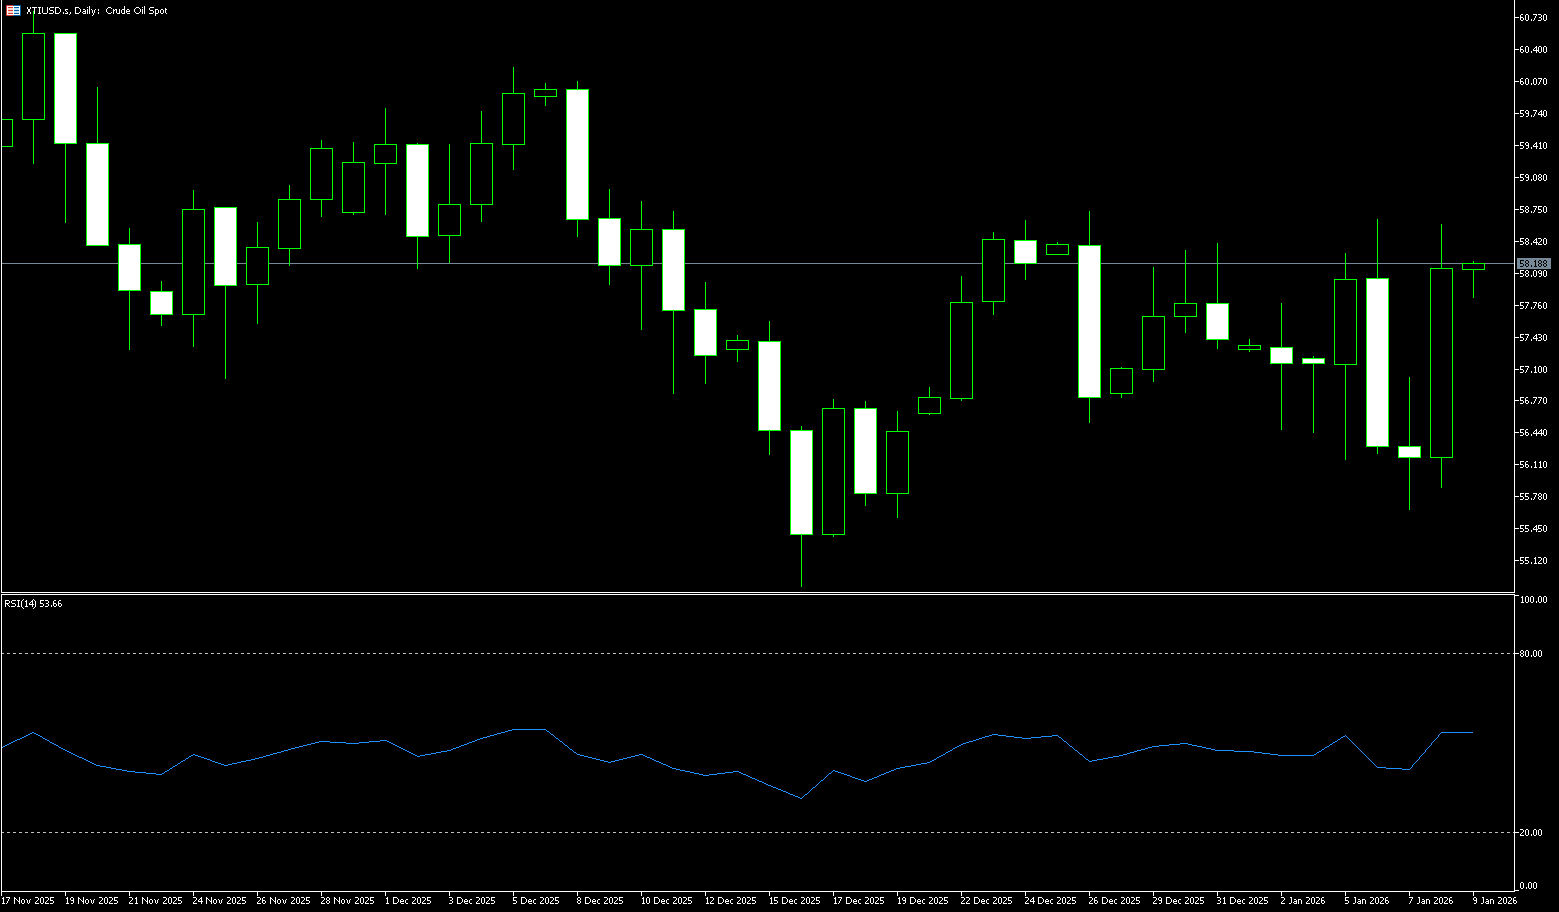
US crude oil is trading around $59.30 per barrel. The market remains concerned about potential US military action against Iran, while also focusing on the reactions of various countries to the situation in Greenland. Friday's rise was mainly driven by short-covering buying ahead of the long weekend. Although the US Navy's USS Abraham Lincoln is expected to arrive in the Persian Gulf next week, the situation does not appear likely to escalate sharply in the short term. Concerns remain about Iran potentially blocking the Strait of Hormuz, which handles about a quarter of global seaborne crude oil shipments. However, potential increases in supply from Venezuela partially offset the geopolitical risks. Earlier last week, oil prices hit multi-month highs due to protests in Iran and Trump's hints of a possible military strike. However, prices subsequently fell sharply by more than 4% on Thursday as tensions eased. Investors are reluctant to hold short positions over the long weekend in case of unforeseen events. If the situation eases further, market focus may shift to the prospect of Venezuelan sanctioned crude oil gradually returning to the international market.
From a technical chart perspective, WTI crude oil is in a critical adjustment phase. The daily chart shows that after reaching $62.19, the recent rally encountered resistance and fell back, currently consolidating around $59.00. In terms of indicators, while the MACD remains in bullish territory, momentum has shown signs of slowing, indicating weakening upward pressure. The RSI (14) is around 54.50, in a neutral-to-strong zone, neither overbought nor showing significant weakness, indicating that the market is in a digestion period following the news-driven rally. This exhibits typical "high-level consolidation" characteristics. The $60 psychological level presents significant resistance, with the next level at $62.19 (last week's high). Without new evidence of geopolitical escalation or tightening in the spot market, a breakout will be difficult. The $58 level is considered a short-term risk control point; a break below this level could trigger further selling by trend-following funds, or even accelerate the decline. Further down, $56.50 (the low of the 2nd of this month) is a crucial medium-term support area.
Today, consider going long on crude oil around $59.28; Stop loss: $59.10; Target: $60.70. 60.50
Spot Gold
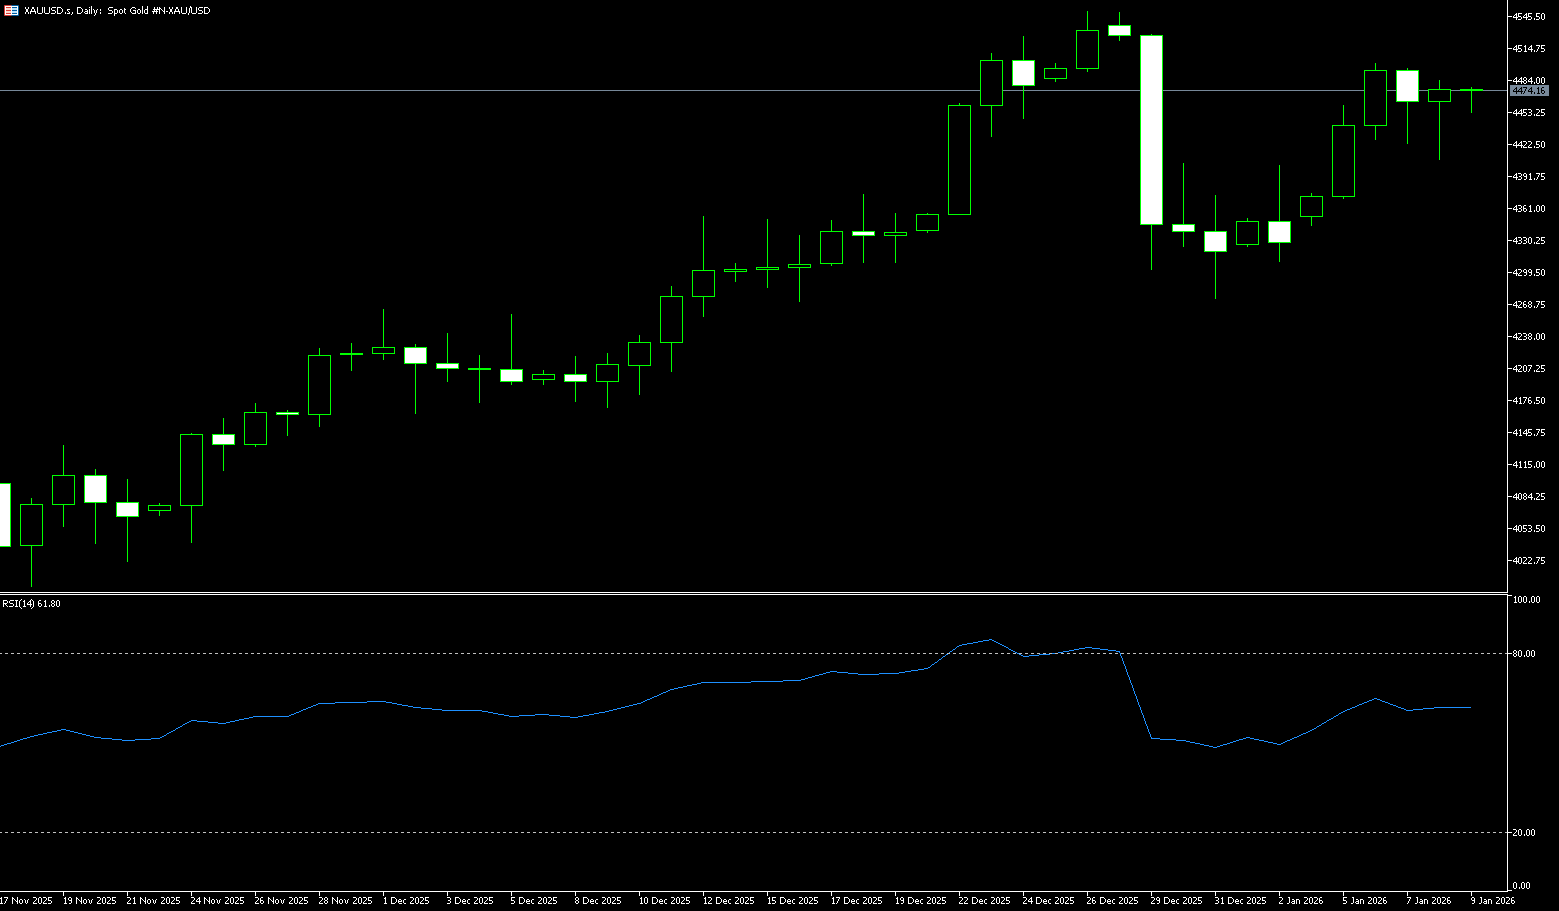
In early Asian trading on January 19th (Beijing time), spot gold opened and continued to refresh its historical high, reaching $4,690.80 per ounce. It is expected to target $4,700 per ounce this week. This is due to Trump's statement that countries opposing the US gaining Greenland will face high tariffs, and several EU countries considering imposing tariffs on €93 billion worth of US goods imported into the EU, leading to a resurgence of safe-haven demand. This quickly boosted market risk aversion, causing spot gold prices to jump nearly $100 at the open on Monday, setting another record high. Overall, Trump's tariff strategy not only ignited the Greenland dispute but also triggered a historic surge in gold prices and a wave of retaliation from Europe. This event exposed the fragility of US-EU relations and could potentially escalate into a broader trade or geopolitical conflict. Financial Markets The market is oscillating between safe-haven demand and economic uncertainty, requiring investors to closely monitor developments to grasp potential opportunities and risks.
Gold prices started the year with an excessively rapid rise, giving bulls a reason to take profits. Currently, investors face two strategic choices: chase the rally after breaking historical highs, or wait for prices to fall back to their intrinsic value range before buying. Ultimately, this depends on individual investment preferences. However, I have observed that long-term bulls tend to favor a more conservative approach, while short-term traders dominate short-term rallies and market fluctuations. As long as the overall upward trend remains unchanged, this pattern is expected to continue. From a daily chart perspective, the main trend for gold remains upward. If gold prices break through the weekly high of $4,690.80 and the $4,700.00 (psychological level) area again, it will signify a resumption of the upward trend; the resistance levels are at $4,750. The $4,800 level. A break below $4,620 (early week low) would turn the secondary trend downwards; a breach of the $4,600 level could reverse the primary trend.
Consider going long on gold today around $4,667; Stop loss: $4,662; Target: $4,695. 4,700
AUD/USD
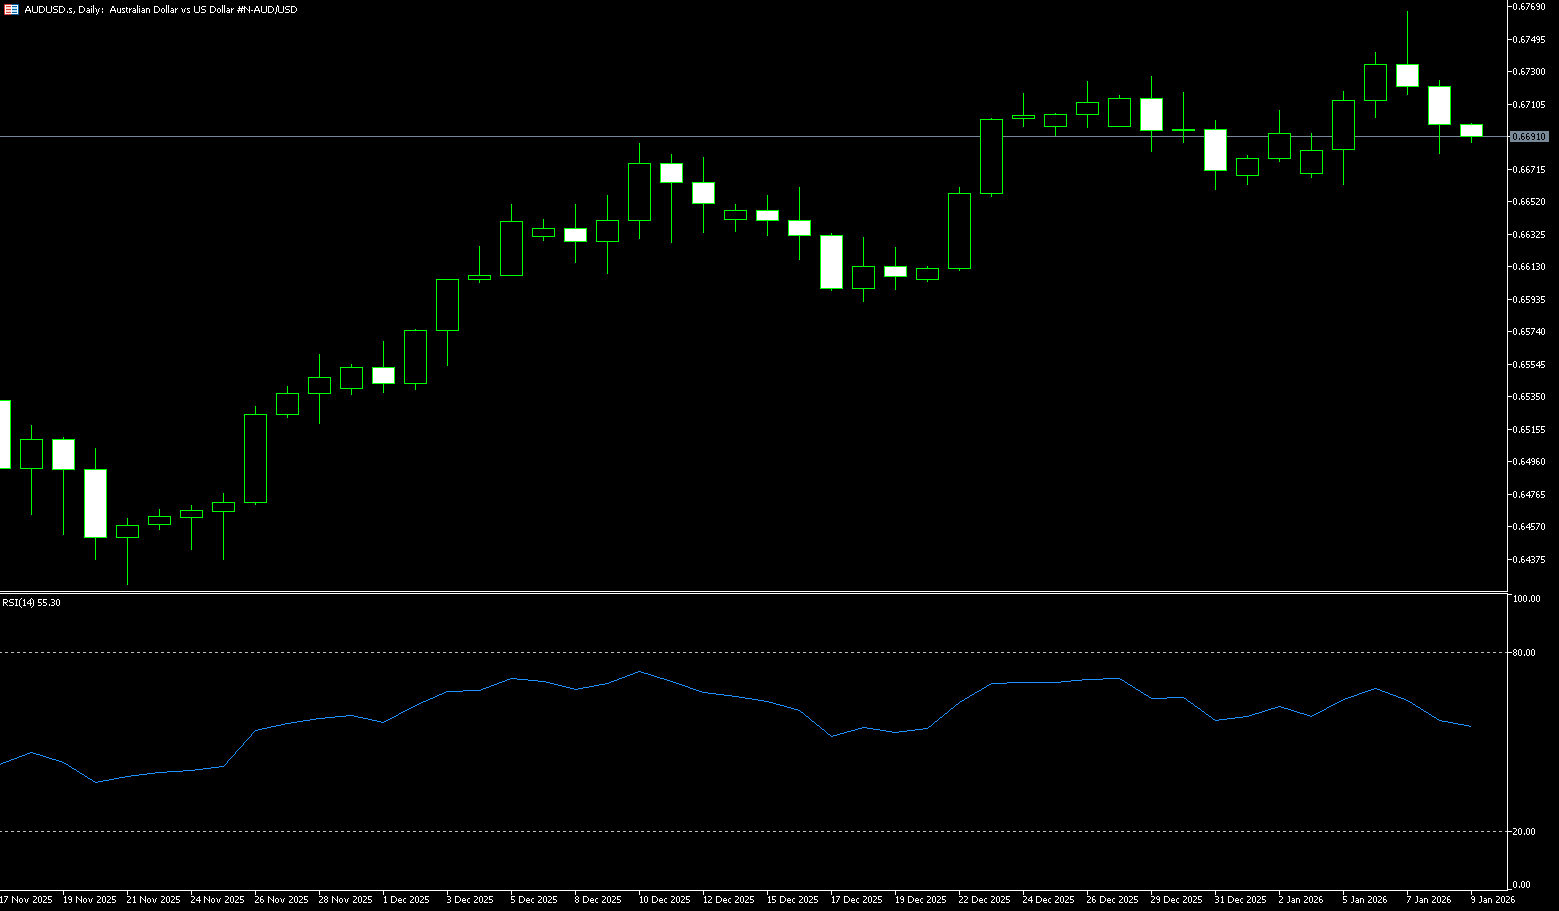
The Australian dollar rose to around US$0.6710 on Monday, rebounding from the previous session, as a weaker US dollar provided support. The dollar was pressured by President Trump's threat to impose an additional 10% tariff on imports from Denmark, Norway, Sweden, France, Germany, the Netherlands, Finland, and the UK starting February 1. Another reason for the currency's appreciation was strengthened expectations of higher interest rates. Oxford Economics Australia warned that the economy remains in an "awkward position," highlighting uneven growth and signs of renewed inflation. They emphasized that the Reserve Bank of Australia is expected to remain patient and may postpone any policy easing. Monday's data showed that Australia's monthly inflation gauge, compiled by the University of Melbourne, rose 1% month-on-month in December 2025, the fastest pace since December 2023, a significant increase from 0.3% in the previous two months.
From the daily chart, it appears that if sellers regain control, the AUD/USD should reach the weekly low of 0.6659 (December 31); 0.6667 {last week's low}; and Initial support was found at 0.6659 (lower Bollinger Band), followed by a pullback to consolidate at the 0.6600 (psychological level). The next resistance level is the 0.6600-0.6589 range, which contains both a psychological level and the 100-day simple moving average. On the other hand, the upper limit for 2026 at 0.6766 (January 7th) presents initial resistance, followed by the 0.6800 (psychological level). Meanwhile, momentum indicators continue to support further gains in the short term: the Relative Strength Index (RSI) has rebounded to around 54.33, while the Average Directional Index (ADX) shows a fairly strong trend around 28.
Consider going long on the Australian dollar today around 0.6700; Stop loss: 0.6690; Target: 0.6740. 0.6750
GBP/USD
GBP/USD rose to around 1.3420 during Monday's European session. The dollar weakened against the pound due to US President Trump's latest tariff threats against Europe. US markets were closed for Martin Luther King Jr. Day. EU ambassadors reached a broad agreement on Sunday to strengthen efforts to dissuade Trump from imposing tariffs on European allies, while France proposed a series of untested economic retaliatory measures. The dollar faced some selling pressure as traders assessed the impact of Trump's latest move on the dollar's long-term status. While tariffs threaten Europe, it is actually the dollar that is bearing the main pressure, as the market is preparing for... The US dollar pricing has increased the political risk premium. Traders will be closely watching the UK employment and consumer price index data to be released later this week. These reports could provide some clues about the Bank of England's monetary policy outlook. Weaker-than-expected results could drag the pound lower against the dollar in the short term.
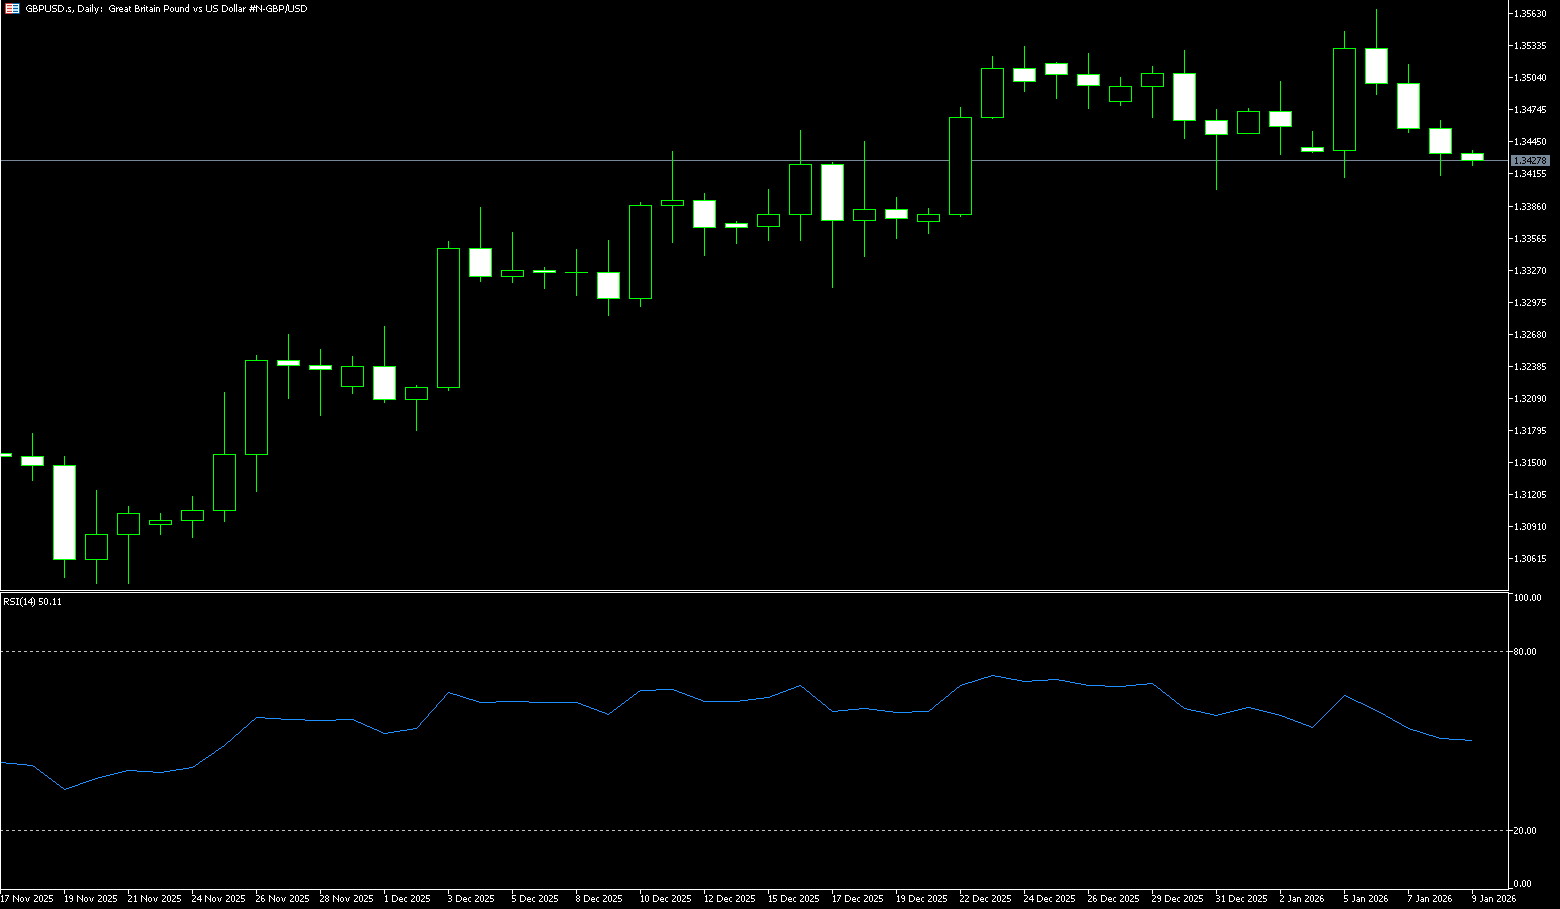
In the short term, GBP/USD turned bearish after breaking below the support trendline drawn from the late November lows on January 6. Since then, the pair briefly consolidated above the 200-day moving average at 1.3406 before breaking below that level to reach a new year low of 1.3344. A daily close below 1.3400 would set the stage for a challenge of the 50-day simple moving average at 1.3340. The 1.3344 level paves the way for the new year's low, followed by the psychological level of 1.3300. The daily RSI (14-day) indicator remains in the neutral 45-50 range this week, indicating weakening bullish momentum and a balance between buyers and sellers. The MACD lines are oscillating at low levels, weakening the rebound signal and indicating the market is still in a correction phase. Conversely, if GBP/USD rises above 1.3400, traders may reclaim the 200-day moving average, followed by 1.3464 (the high of January 14th) and the 1.3500 level.
Consider going long on GBP today around 1.3412; Stop loss: 1.3400; Target: 1.3460. 1.3470
USD/JPY
The yen strengthened to 158 yen per dollar on Monday, reaching a one-week high of 157.42, as renewed geopolitical and trade concerns boosted demand for safe-haven assets. US President Donald Trump's threat to impose new tariffs on eight European countries in an attempt to control Greenland drew criticism from European leaders. Domestically, investors focused on the Bank of Japan's policy decision this week, with interest rates widely expected to remain unchanged, and market attention focused on potential actions in June. The market also considered the possibility that Prime Minister Sanae Takaichi might call a snap election next month to consolidate power and push for expansionary fiscal policies. Takaichi was reportedly considering pledging to suspend the 8% sales tax on food during her campaign, a move aimed at alleviating Japan's rising food costs.
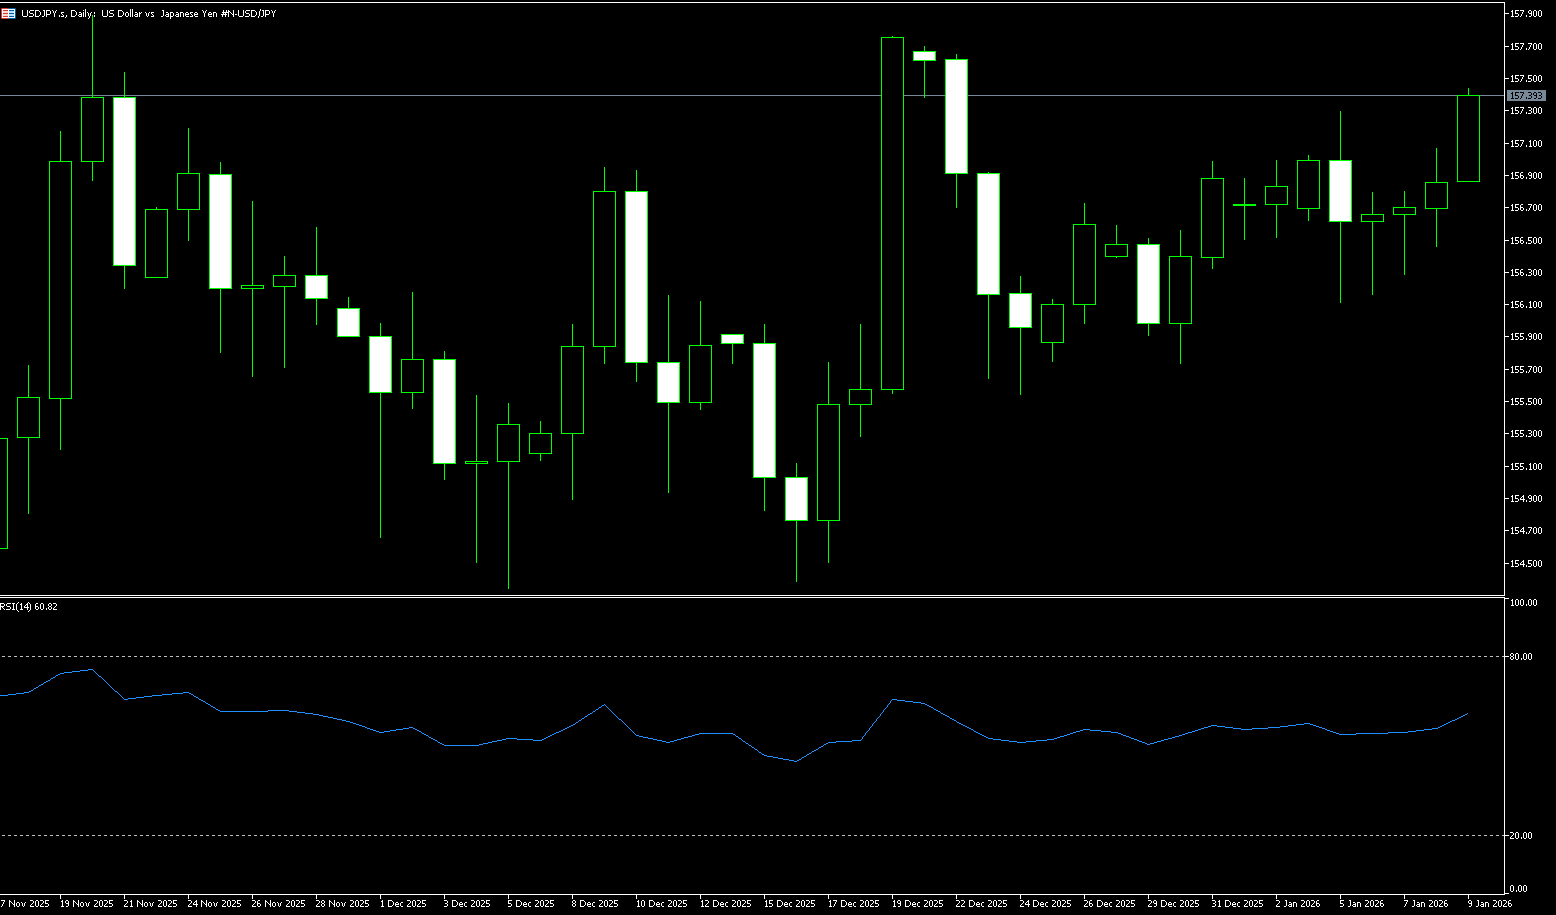
USD/JPY traded in a narrow range around 158.00 at the start of the week. A break above 158 could pave the way for further gains, although a stronger rally would require additional momentum confirmation. The Moving Average Convergence/Divergence (MACD) indicator is hovering below zero, with a reading near -0.01, suggesting easing bearish pressure. The 14-day Relative Strength Index (RSI) is at 56 (neutral-bearish), stabilizing after the previous oversold decline. Meanwhile, the USD/JPY pair is trading below its 5-day simple moving average around 158.47, which should limit any rebound. A close above this moving average would skew the short-term trend towards 149.45 (last week's high), with a break above targeting the psychological level of 160. On the downside, 157 is the first support level, followed by strong second support at the 50-day simple moving average of 156.35. A break above this level would target the 155.00 psychological level.
Consider shorting the USD around 158.30 today; stop loss: 158.50. Target: 157.50; 157.30
EUR/USD
The euro/dollar pair rose to around 1.1645 in early European trading on Monday, ending a four-day losing streak. The dollar faced selling pressure on the euro as US President Trump threatened to impose tariffs on eight European countries opposing his plan to buy Greenland, starting February 1st and increasing the rate to 25% in June until a "full and complete purchase agreement for Greenland" is reached. US markets were closed on Monday for Martin Luther King Jr. Day. Europe prepared to retaliate on Monday after Trump imposed additional tariffs on allies. European leaders will hold an emergency meeting in the coming days to discuss possible retaliatory measures. Concerns about a renewed escalation of the trade war and the long-term impact of Trump's latest moves weakened the dollar, providing a tailwind for this major currency pair.
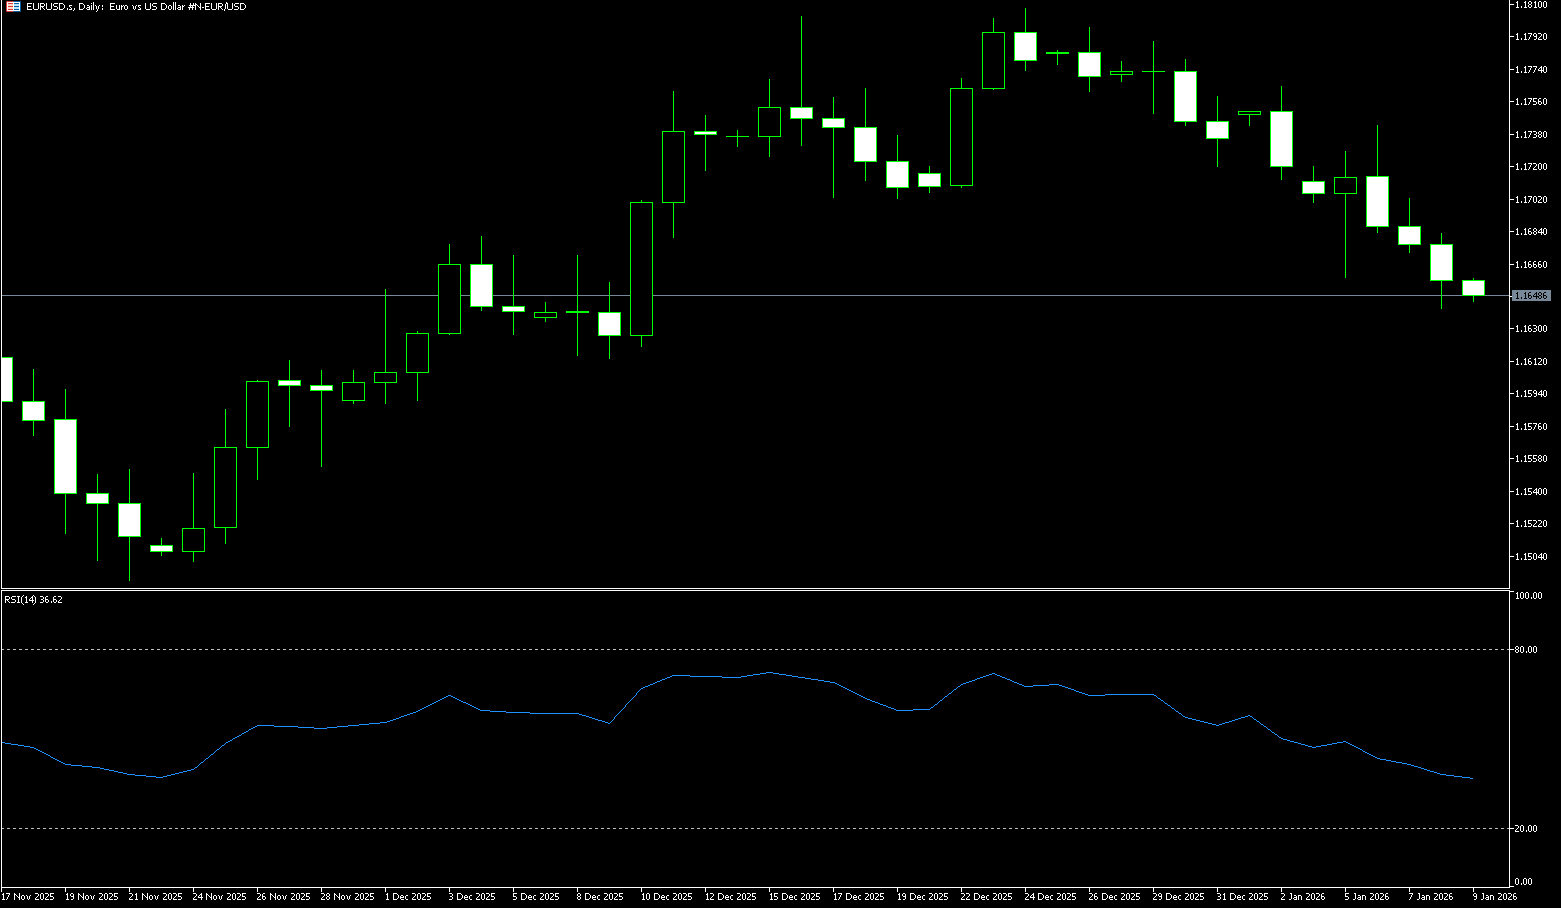
Currently, EUR/USD... The pair's movements are driven by US developments, far exceeding any dynamics within the Eurozone. Continued downward momentum could push the pair to challenge its key 200-day simple moving average at 1.1586, and a loss in this area could pave the way for a deeper decline, targeting the November low of 1.1555 (November 28th), followed by the August low of 1.1500 (a psychological level). Momentum indicators continue to support the pair's recovery: the 14-day Relative Strength Index (RSI) has rebounded to around 42, while the Average Directional Index (ADX) near 19 still shows a fairly strong trend. On the other hand, the 45-day simple moving average at 1.1668 presents immediate resistance. A break above this level could see the pair attempt to test 1.1700 (a psychological level) and 1.1701 (the 20-day simple moving average). Then there's the 1.1742 level (January 6th high).
Today, consider going long on the Euro around 1.1630; Stop loss: 1.1620; Target: 1.1675; 1.1680
Disclaimer: The information contained herein (1) is proprietary to BCR and/or its content providers; (2) may not be copied or distributed; (3) is not warranted to be accurate, complete or timely; and, (4) does not constitute advice or a recommendation by BCR or its content providers in respect of the investment in financial instruments. Neither BCR or its content providers are responsible for any damages or losses arising from any use of this information. Past performance is no guarantee of future results.
Lebih Liputan


Pendedahan Risiko:Instrumen derivatif diniagakan di luar bursa dengan margin, yang bermakna ia membawa tahap risiko yang tinggi dan terdapat kemungkinan anda boleh kehilangan seluruh pelaburan anda. Produk-produk ini tidak sesuai untuk semua pelabur. Pastikan anda memahami sepenuhnya risiko dan pertimbangkan dengan teliti keadaan kewangan dan pengalaman dagangan anda sebelum berdagang. Cari nasihat kewangan bebas jika perlu sebelum membuka akaun dengan BCR.
BCR Co Pty Ltd (No. Syarikat 1975046) ialah syarikat yang diperbadankan di bawah undang-undang British Virgin Islands, dengan pejabat berdaftar di Trident Chambers, Wickham’s Cay 1, Road Town, Tortola, British Virgin Islands, dan dilesenkan serta dikawal selia oleh Suruhanjaya Perkhidmatan Kewangan British Virgin Islands di bawah Lesen No. SIBA/L/19/1122.
Open Bridge Limited (No. Syarikat 16701394) ialah syarikat yang diperbadankan di bawah Akta Syarikat 2006 dan berdaftar di England dan Wales, dengan alamat berdaftar di Kemp House, 160 City Road, London, City Road, London, England, EC1V 2NX. Entiti ini bertindak semata-mata sebagai pemproses pembayaran dan tidak menyediakan sebarang perkhidmatan perdagangan atau pelaburan.

 English
 简体中文
简体中文
 繁體中文
繁體中文
 Bahasa
Melayu
Bahasa
Melayu
 Tiếng
Việt
Tiếng
Việt
 ไทย
ไทย
 日本語
日本語
 한국어
한국어
 ភាសាខ្មែរ
 español