


0
The US Dollar Index
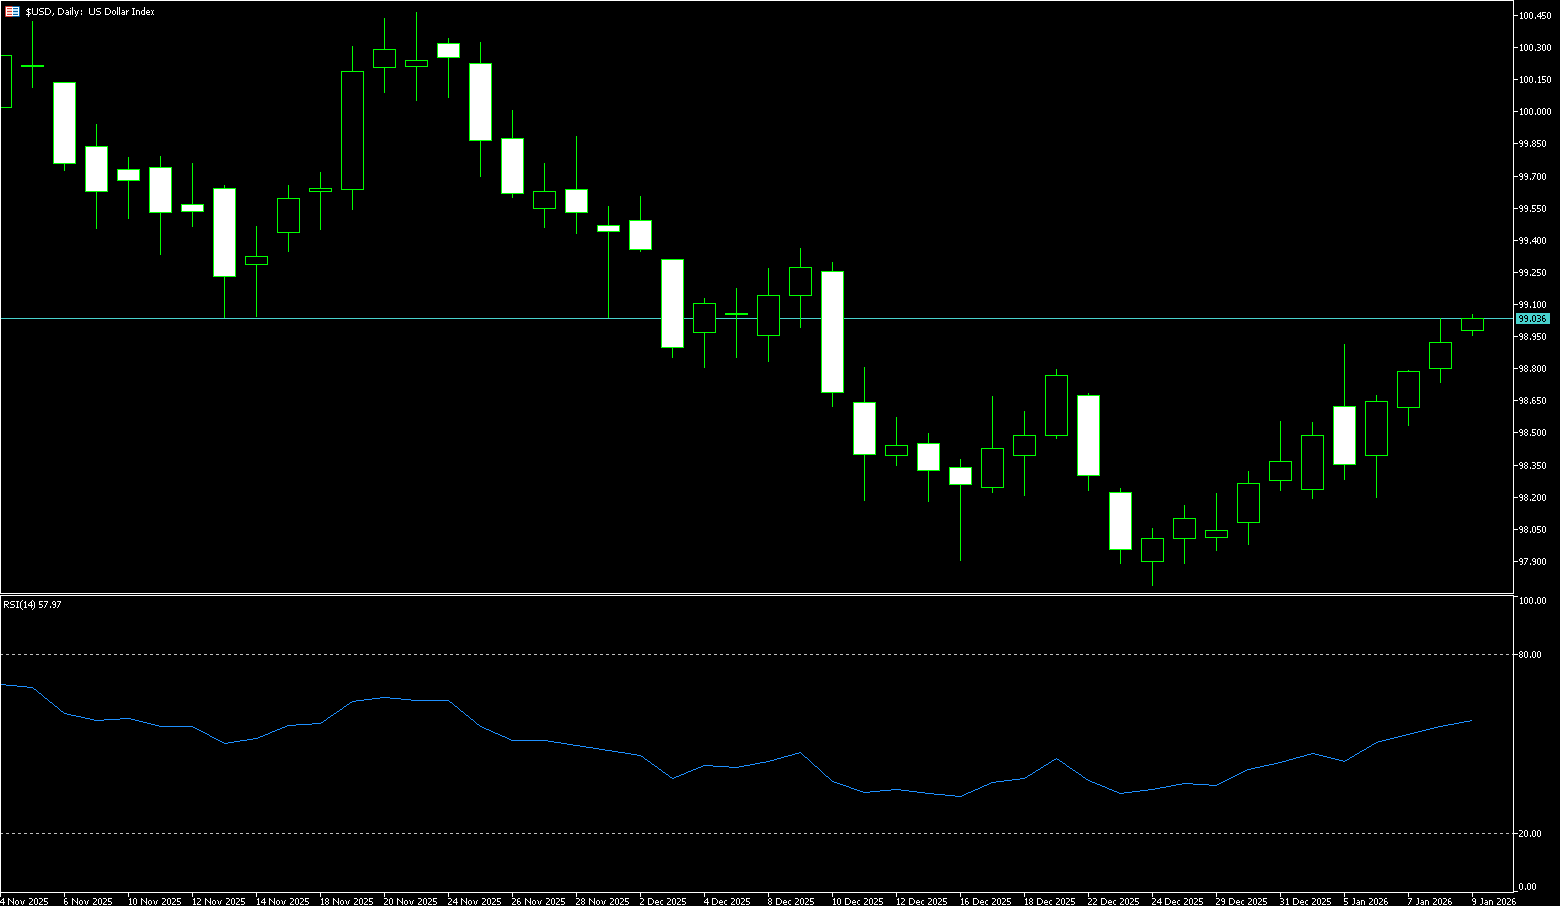
The US dollar index remained stable above 99.00 last week, posting its third consecutive weekly gain, as strong US economic data dampened expectations for further interest rate cuts by the Federal Reserve. Weekly jobless claims were significantly lower than expected, indicating a resilient labor market, while some manufacturing surveys also exceeded expectations. Several Fed officials also highlighted signs of a stable labor market and warned of potential inflation risks. The market widely expects the Fed to keep interest rates unchanged later this month, with predictions for the next rate cut now pushed back to June or later. On trade, the US agreed to reduce tariffs on Taiwanese goods from 20% to 15%, while Taiwanese companies pledged to invest at least $250 billion to expand their chip manufacturing capabilities in the US. Elsewhere, President Trump indicated a possible delay in action against Iran but reiterated his intention to acquire Greenland. Meanwhile, market sentiment improved after President Donald Trump stated he had no plans to dismiss Fed Chair Powell, despite reports of potential Justice Department threats of prosecution, and hinted at a possible delay in action against Iran. Additionally, the signing of a trade agreement between the US and Taiwan aimed at boosting US semiconductor production through tariff reductions further supported market sentiment.
Last week, the US dollar index generally exhibited a low-level consolidation pattern with a slight upward bias. The core trading range was 98.72 (200-day simple moving average) - 99.50 (last week's high), reflecting a range-bound trading pattern with support below and resistance above. US inflation data met expectations and employment data were relatively strong, supporting the dollar's short-term resilience; however, weakening US Treasury yields and a narrowing interest rate differential limited the index's upside potential. Currently, the daily chart's moving average system shows the 5-day and 10-day moving averages flattening, with the index oscillating around these averages without a clear unilateral trend. The 200-day simple moving average at 98.72 has become a key dividing line between bulls and bears, holding firm after multiple tests during the week, proving effective support. On the other hand, the 14-day Relative Strength Index (RSI) remained in the slightly above-neutral 61 range, without overbought or oversold conditions, indicating a balance between bulls and bears, with moderate rebound momentum and no clear trend breakout potential. The MACD indicator shows the two lines close to the zero line, with alternating red and green bars and relatively short energy bars, indicating weak momentum and suggesting short-term consolidation without clear directional guidance. Last week, the US dollar index consolidated within a slightly bullish range, with solid support at 98.72. A break below this level could lead to a test of 98.54 (the 20-day simple moving average) or even 98.00 (a psychological level). Meanwhile, the US dollar index rose instead of falling, and is now poised to retest 99.50 (last week's high), potentially breaking through to the 100 psychological level and climbing further to 100.36 (last November's high).
Today, consider shorting the US Dollar Index around 99.48; Stop loss: 99.60; Target: 99.00; 98.95
WTI Crude Oil
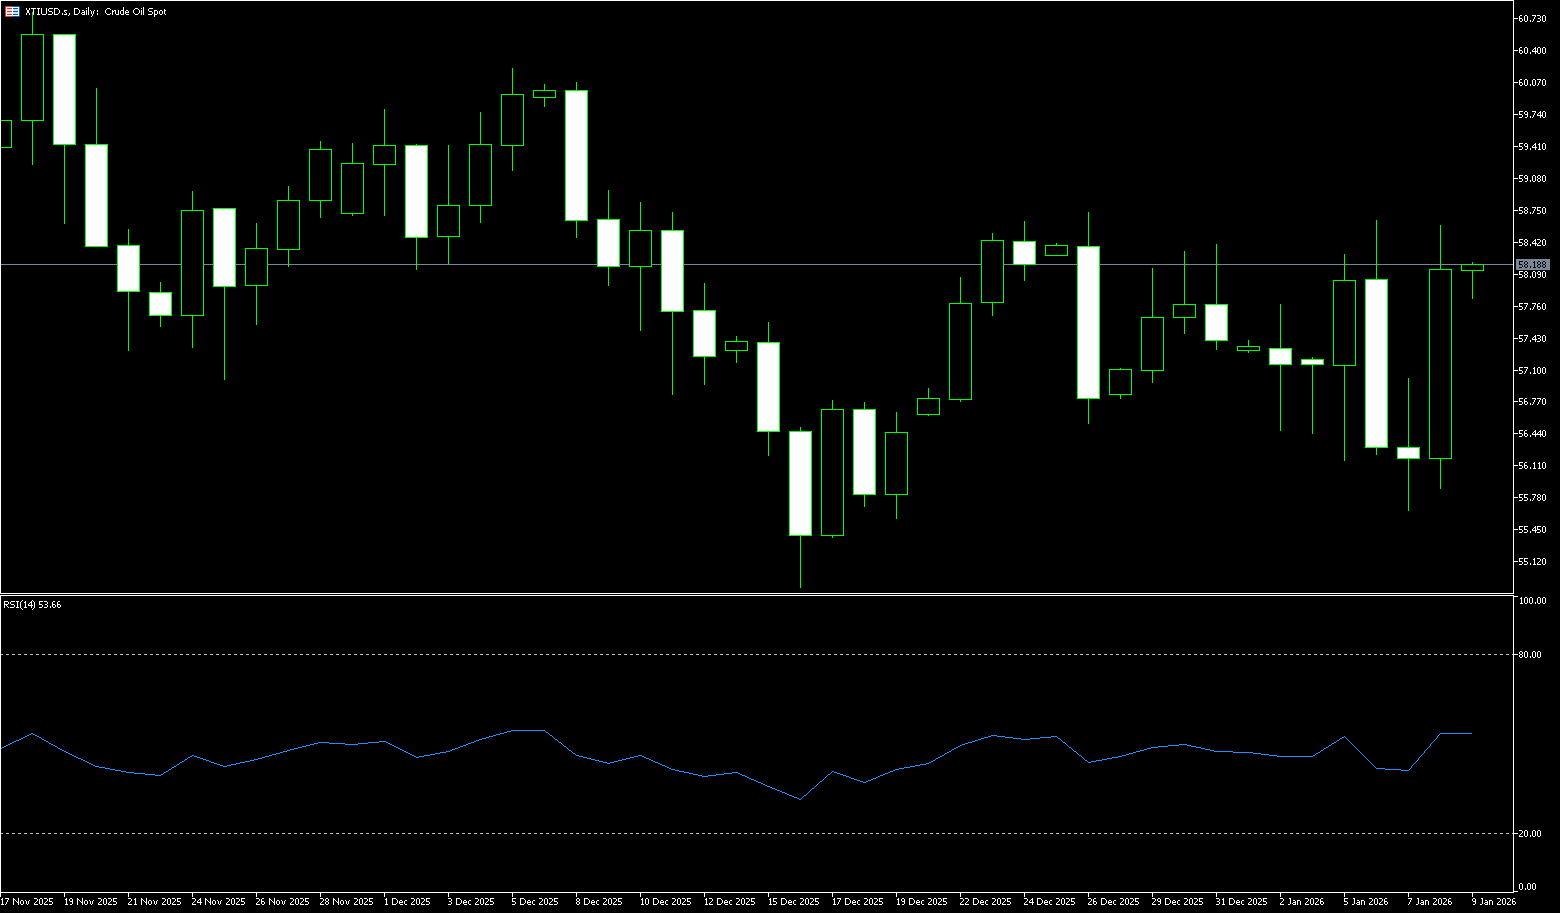
WTI crude oil rose for the fourth consecutive week, hovering slightly below $60, after concerns about a potential US military strike against Iran eased. President Trump softened his earlier threats of military action against Iran on Wednesday, stating he had received assurances that there would be no further killings and that the operation would not continue. Reports on Thursday also indicated that Israel and several Middle Eastern allies had asked the US to postpone any attack on Iran, fearing Iranian retaliation against their countries. These developments reduced the risk of an impending conflict that could disrupt Iranian oil production or key shipping routes in the region. This "emotion-driven—rapid reversal" pattern is not uncommon in commodity markets, especially in commodities like crude oil that possess both physical and financial attributes. When tensions escalate, funds rush to buy safe havens; once the storm has passed, profit-taking quickly occurs, leading to sharp price fluctuations. This pullback perfectly illustrates this logic—not a sudden shift in fundamentals, but rather a fundamental shift in the market's pricing of the "war narrative." Nevertheless, oil prices remain on a moderate upward trajectory after last week's gains. Internal turmoil in Iran, political instability in Venezuela, and disruptions to Kazakh exports from the Black Sea have supported the oil market.
WTI crude oil experienced a "surge followed by a sharp drop" last week. At the beginning of the week, driven by Middle East geopolitical premiums, it rose to $62.19, its highest level since October of last year. However, in the latter half of the week, it fell sharply to around $58.70 due to easing tensions and expectations of ample supply. This erased all of the week's gains, and the bullish technical structure has weakened. The bullish structure on the daily chart has weakened, with bearish momentum dominating short-term movements. However, support remains at the $58.09 and $58.00 (psychological levels) area, supported by the 20-day simple moving average. The 5/10-day moving averages on the daily chart show signs of a death cross, and the moving averages are converging. The 14-day Relative Strength Index (RSI) has fallen to 53, and the MACD has turned downwards above the zero line with shortening red bars. The price has broken below the 5-day simple moving average at $59.61, turning support into resistance. On the other hand, geopolitical risks have not been completely eliminated, and the price is likely to remain range-bound between $56.50 (the low of the 2nd of this month) and $62.10 (the high since last October), awaiting a new catalyst. Therefore, next week's support area to watch is $58.09 (the 20-day simple moving average), while strong support is seen at $57.72 (the 25-day simple moving average) and the $56.50 (the low of the 2nd of this month) area. Regarding the upside, the first resistance is $59.63 (5-day simple moving average); the next strong resistance is at $60.00 (a psychological level); the medium-term resistance is the $61.96-$62.19 area (200-day simple moving average and last week's high resistance).
Today, consider going long on crude oil near $59.15; stop loss: $59.00; target: $60.20; $60.50
Spot Gold
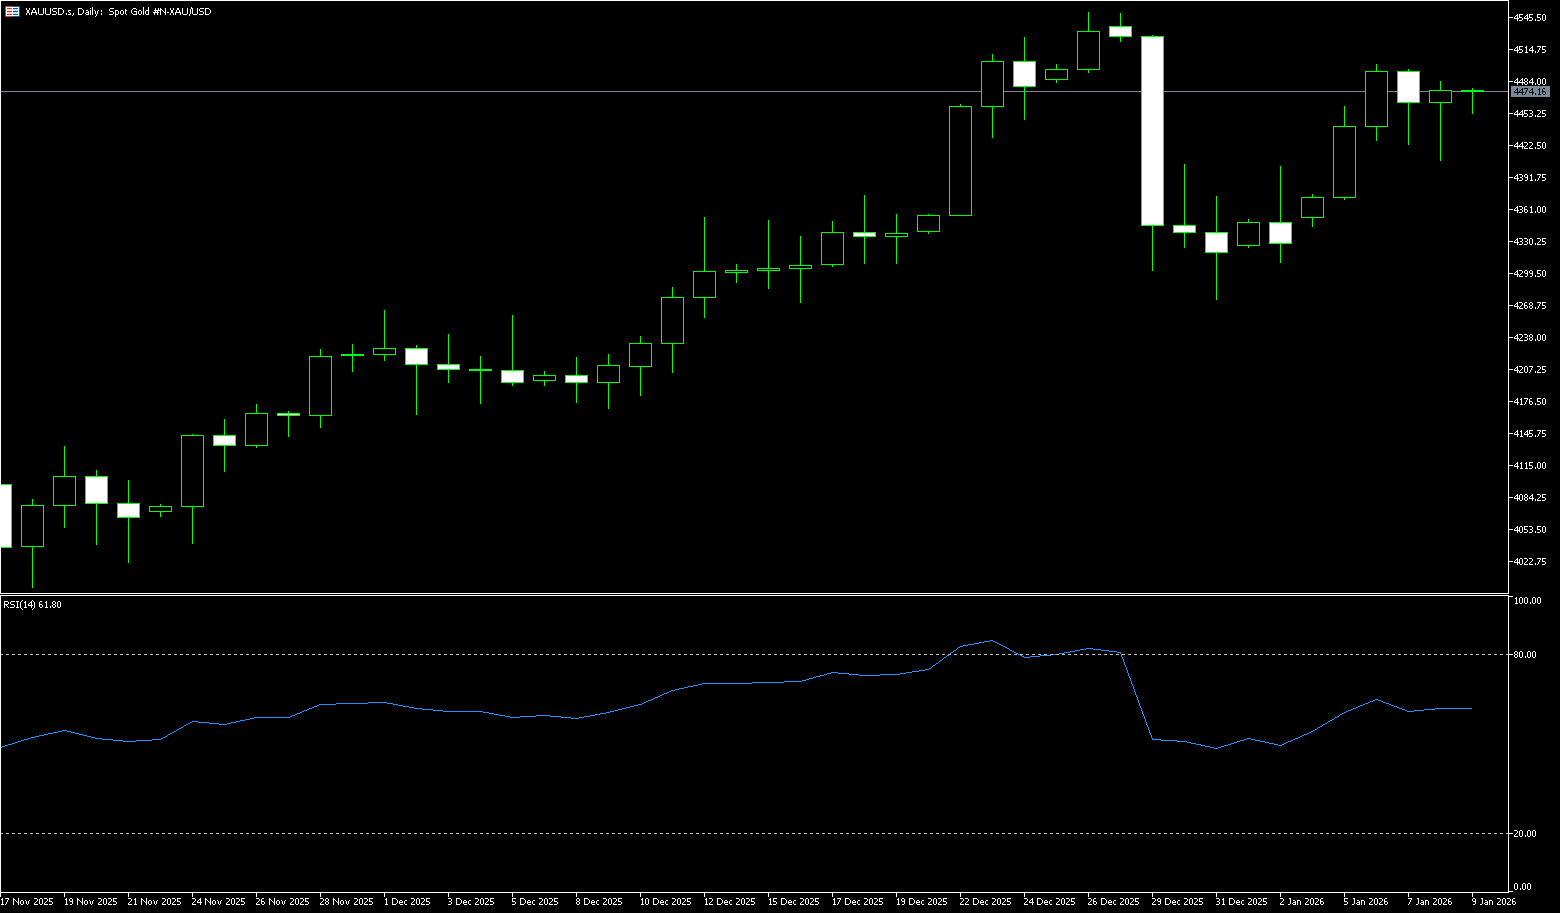
Last week, global financial markets presented a complex trading pattern. Market focus was concentrated on the rapidly evolving geopolitical situation in Greenland and its transmission effect on traditional safe-haven assets, while the US statements on key mineral tariffs and the Iran issue further shaped short-term market sentiment. At the beginning of last week, after gold prices reached a new historical high of $4,643, the market entered a consolidation phase. This pullback was directly attributed to the softening of geopolitical pressure and the easing of trade risks mentioned above. Gold, as the ultimate safe-haven asset, is most sensitive to the Greenland crisis. When the situation shifted from "direct confrontation" to "military exercises and diplomatic negotiations," some short-term bullish investors chasing event-driven moves chose to take profits. This capital flow and the bond market's performance formed a clear transmission chain: easing risk aversion → slight increase in US Treasury yields (price decline) → slightly increased expected opportunity cost of holding gold → pressure on gold. However, this does not mean that gold's safe-haven appeal has faded. The current market easing is built on a fragile balance of "NATO demonstrating unity to deter risky behavior." Misjudgments in rhetoric or action by any party could quickly reverse market sentiment.
Last week, spot gold generally showed a high-level consolidation with a slightly bullish bias before encountering resistance and pulling back. The rebound of the US dollar, easing geopolitical risks, and technical overbought conditions all contributed to the pullback. Currently, it is hovering near a key support level, with increasing short-term downward pressure, but the medium-to-long-term bullish trend remains intact. The daily chart shows gold prices trading above $4,537.70 (last Friday's low) and $4,547.70 (the 9-day simple moving average), indicating a short-term bullish bias. The 14-day Relative Strength Index (RSI) has retreated from overbought territory but remains in the strong zone, the MACD is in a golden cross, and the Bollinger Bands are widening upwards, with gold prices oscillating near the upper band, while the lower band provides effective support. Furthermore, the moving average system is in a standard bullish alignment, with the 5-day and 10-day moving averages continuing to rise and providing support. Gold prices are steadily climbing along these moving averages, and the consecutive daily gains demonstrate the resilience of the bulls. Looking ahead to the coming week, the key technical focus for gold is whether it can find effective support around $4,547.70 (the 9-day simple moving average). If this level is breached, and no new deterioration in fundamentals occurs (such as a disruption in diplomatic channels or escalating military confrontation rhetoric), gold prices may enter a consolidation range between $4,547.77 (9-day simple moving average) and $4,549.80 (previous historical high), with the next target being the psychological level of $4,500, to digest recent gains and await the next catalyst. On the upside, the first resistance level for gold is at $4,543 (historical high). If gold prices stabilize above this level, it could pave the way for a breakout towards $4,671.30 (the upper Bollinger Band), and subsequently challenge the psychological level of $4,700-$4,750.
Consider going long on gold around 4,577 today; Stop loss: 4,572; Target: 4,605; 4,615
AUD/USD
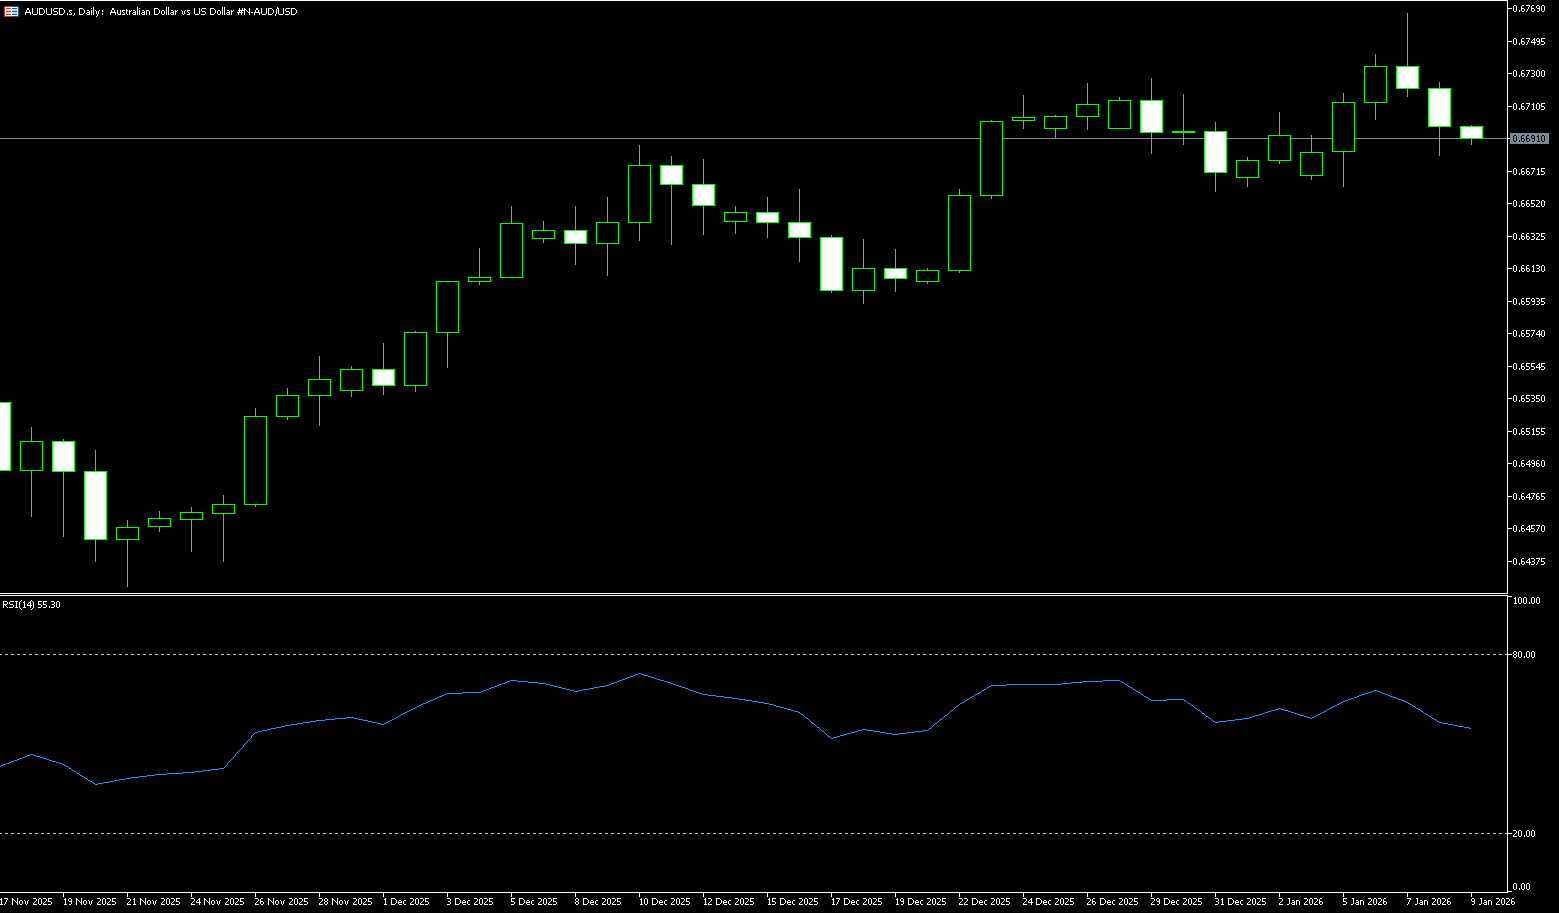
The Australian dollar traded steadily within the 0.6680-0.6720 USD range last week and is poised for a modest weekly gain as market expectations of a potential rate hike by the Reserve Bank of Australia (RBA) reaffirmed support for the currency. Last week, the Commonwealth Bank of Australia raised its owner-occupied mortgage rates by up to 0.7 percentage points, increasing its lowest two-year fixed rate to 5.79%. Macquarie Bank subsequently raised rates by 0.25 percentage points across all fixed loan maturities. These moves followed similar rate hikes by other major Australian banks in December, highlighting growing market expectations that cash rates may remain high for an extended period. The market is currently pricing in a 27% probability of a 25 basis point rate hike at the RBA's February meeting, with expectations rising sharply to around 76% by May. Meanwhile, global stock markets rose, particularly the Australian stock market, which climbed for the fifth consecutive trading day and approached a two-month high, providing additional support for the Australian dollar.
Last week, the Australian dollar traded in a weak, high-level consolidation pattern against the US dollar, fluctuating within a core range of 0.6680-0.6720. The market lacked clear unilateral momentum, with bulls and bears repeatedly battling around key moving averages and psychological levels, resulting in limited volatility. After failing to continue the rebound from the early January high of 0.6766, the Australian dollar remained under pressure. The upper Bollinger Band at 0.6733 and last week's high of 0.6727 have become resistance levels, while a densely traded support zone exists between 0.6680 and 0.6700. Overall, the market exhibited a "high-level range-bound" pattern, without any significant breakout or breakdown signals. The 14-day RSI on the daily chart, after approaching 69.13 (slightly overbought), gradually fell back to 53.04 (neutral range), indicating that bullish momentum continued to weaken and market sentiment turned cautious, with no obvious overbought or oversold extreme signals. The MACD, while maintaining a bullish alignment, showed weakening upward momentum, suggesting increased short-term downward pressure. There were no clear death or golden cross signals, indicating significant oscillation. Regarding the moving average system, the 10-day moving average at 0.6702 formed short-term resistance, while the 50-day moving average at 0.6616 provided medium-term support. The exchange rate repeatedly crossed short-term moving averages, lacking a clear trend guidance from the bullish/bearish alignment of the moving averages, indicating a clear range-bound pattern. Meanwhile, after failing to continue the rebound trend from early January last week, the Australian dollar remained under pressure, repeatedly testing the 0.6727-0.6733 resistance level without success. Furthermore, the narrowing policy expectations between Australia and the US suppressed the Australian dollar's upside potential; fluctuations in commodity prices and the rebound in the US dollar index further exacerbated the Australian dollar's volatility. Therefore, on the upside, the initial resistance area to watch is the Bollinger Band upper line at 0.6733 and last week's high of 0.6727, followed by 0.6766 (this year's high), with a break above targeting the psychological level of 0.6800. On the other hand, if 0.6667 (last week's low) and 0.6659 (the lower Bollinger Band) are breached, a pullback to the 0.6600 (psychological level) level is expected for consolidation.
Today, consider going long on the Australian dollar near 0.6675; Stop loss: 0.6664; Target: 0.6720; 0.6730
GBP/USD
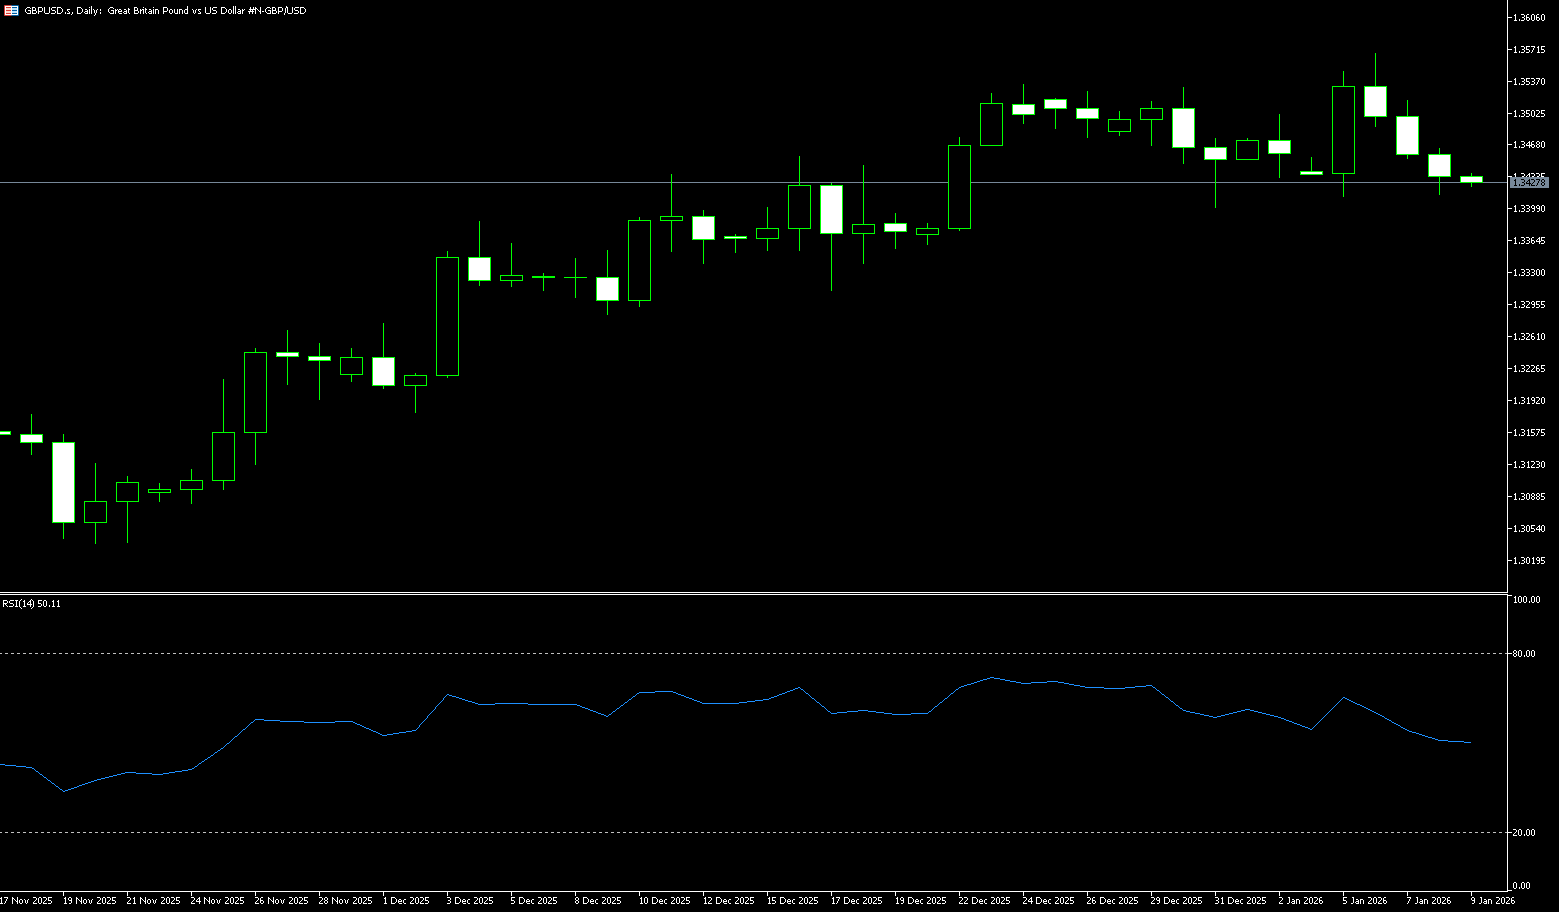
The pound traded cautiously near a four-week low of 1.3360 against the dollar during last week's trading session. It is currently testing the 1.3400 level, having dipped slightly in previous sessions. The pair is supported by renewed selling around the US dollar as risk sentiment improved. The focus now shifts to geopolitical developments and comments from Federal Reserve officials. On the other hand, GBP/USD is under pressure as markets anticipate the Fed will pause monetary easing at its monetary policy meeting later this month. According to the CME FedWatch tool, traders have almost priced in the possibility that the Fed will keep interest rates in the 3.50%-3.75% range at its January policy meeting. Speculation that the Fed will keep rates unchanged is driven by persistently high pressure on the dollar. Kansas City Federal Reserve Bank President Jeffrey Schmid also stated that monetary policy needs to be "moderately restrained" because "inflation is overheating." Meanwhile, the pound is expected to remain on the sidelines as investors turn their attention to next week's UK employment and consumer price index (CPI) data. Investors will be closely watching UK data for new clues about the Bank of England's monetary policy outlook.
Last week, the British pound against the US dollar generally trended downwards from its highs. After a slight rise at the beginning of the week, it gradually came under pressure, with the decline widening before the weekend. The core trading range for the week was 1.3353 (45-day moving average) - 1.3500 (psychological level). The weekly chart closed negative, indicating intensified short-term bullish and bearish competition, while the medium-term bullish trend remained intact. Overall, the currency pair rose and then fell last week, with the pound lacking fundamental support and bearish sentiment rising within the volatile trading range. The daily RSI (14-day) remained in the neutral range of 45-50 during the week, indicating weakening bullish momentum and a balance between bulls and bears. The MACD lines oscillated at low levels, weakening the rebound signal and indicating that the pair is still in a short-term correction phase. Regarding the moving average system, the 5-day and 10-day moving averages flattened out. The price was above the short-term moving averages at the beginning of the week but broke below them before the weekend, indicating the failure of short-term support. The 20-day and 50-day moving averages remain in a bullish alignment, indicating that medium-term support has not been broken. Meanwhile, the Bank of England's policy is relatively hawkish compared to the Federal Reserve, and this policy divergence supports the pound. If subsequent UK economic data improves, it is expected to resume its upward trend. The medium-term upward trend of GBP/USD remains intact, and the high-level consolidation pattern since December 2025 continues. The first support level is at 1.3353 (45-day moving average). A break below this level would extend to the 1.3300 psychological level. On the upside resistance side, the 1.3500 psychological level is a significant resistance. A break above this key level would target 1.3567 (the high of June 6th), and a break below that could trigger a new trend towards the psychological level of 1.3600.
Today, consider going long on GBP/JPY around 1.3370; Stop loss: 1.3360; Target: 1.3420; 1.3430
USD/JPY
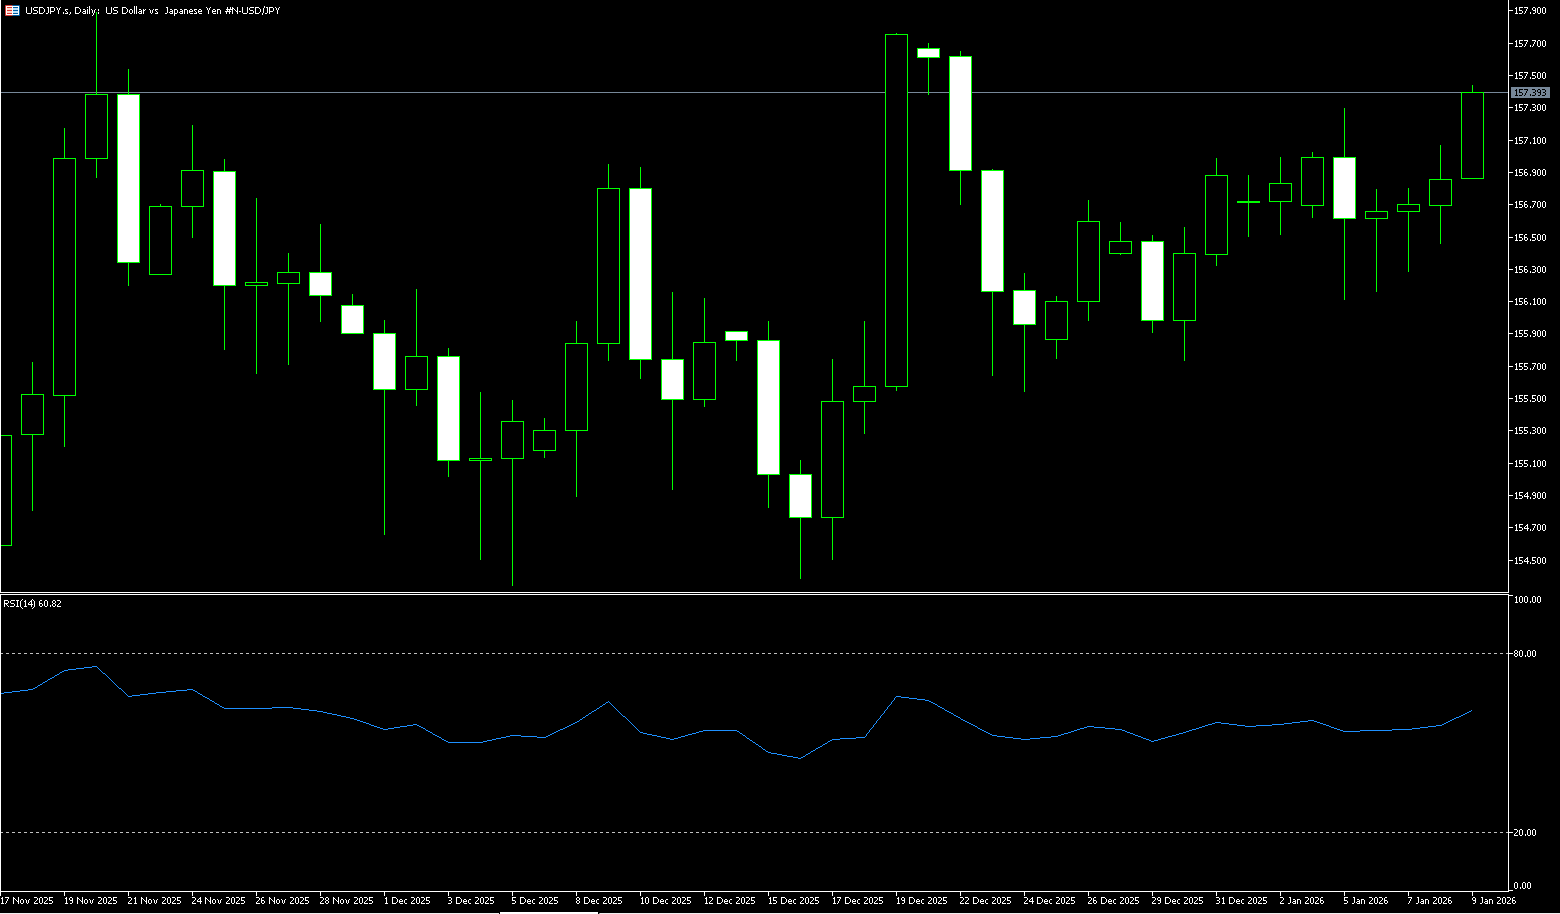
Last week, USD/JPY generally traded in a high-level consolidation pattern with a slight upward bias. It initially rose slowly to 159.45 (the high on January 14th), then retreated, giving back to around 158.00 by the end of the week. Technically, the bullish structure remains intact, but upward momentum has weakened. Expectations of intervention near the 160 level brought significant selling pressure. Investors are awaiting the Bank of Japan's upcoming policy meeting for any signals regarding its interest rate hike trajectory. The central bank is expected to maintain its current policy next week, with the market anticipating the next rate hike around June. Bank of Japan Governor Kazuo Ueda reiterated that the central bank is prepared to raise interest rates if economic and price developments meet expectations. The yen was also supported this week by concerns about official intervention as it approached the key 160 level, with Japanese authorities warning against rapid, one-sided currency fluctuations. Meanwhile, rumors that Japanese Prime Minister Sanae Takaichi might call a snap election next month to push for more aggressive fiscal spending continued to put pressure on the yen. It was reported that Takaichi would provide further details regarding the dissolution of the House of Representatives to ruling coalition officials on January 19.
Last week, the USD/JPY pair generally traded with a slightly bullish bias at high levels. It initially rose slowly to 159.45 (the high on January 14), before pulling back to around 158.00 by the end of the week. Technically, the bullish structure remained intact, but upward momentum weakened. Expectations of intervention near the 160 level brought significant selling pressure. The week closed with a small bullish doji candlestick with a long upper shadow. The medium-term bullish trend remains intact, but the short-term trend has entered a high-level consolidation phase. 158.00 is a key psychological support level on the daily chart; if the closing price falls below this level, the short-term bullish logic may be invalidated. Strong resistance lies at 159.50-160.00, with expectations of Japanese intervention limiting further gains. The MACD golden cross on the daily chart continues, but the momentum bars have shortened slightly. The 14-day Relative Strength Index (RSI) remains in the 58-63 range, not overbought, but upward momentum is slowing, suggesting a potential pullback. Meanwhile, the 5-day, 10-day, and 20-day moving averages are in a bullish alignment, and the currency pair has consistently traded above them, indicating a healthy medium-term bullish structure. The 50-day moving average at 156.27 provides strong support. On the other hand, the 160 level is a key level for Japanese intervention; the Finance Minister has repeatedly intervened verbally, causing the market to become cautious near this price level, preventing the exchange rate from rising too quickly. Therefore, the medium-term bullish trend remains intact, but the short-term market has entered a high-level consolidation phase. 158.98 (upper Bollinger Band) and 159.00 (psychological level) are key resistance levels on the daily chart. If the closing price breaks below these levels, the short-term bullish logic may fail. The resistance zone above is extremely strong at 159.45 (last week's high) - 160.00 (psychological level), with expectations of Japanese intervention suppressing gains. 157 is the first support level, followed by the strong second support at the 50-day moving average of 156.27. A break below these levels would target 155.20 (lower Bollinger Band) and the 155.00 (psychological level) area.
Today, consider shorting the Japanese Yen near 158.22; Stop loss: 158.50; Target: 157.20; 157.00
EUR/USD
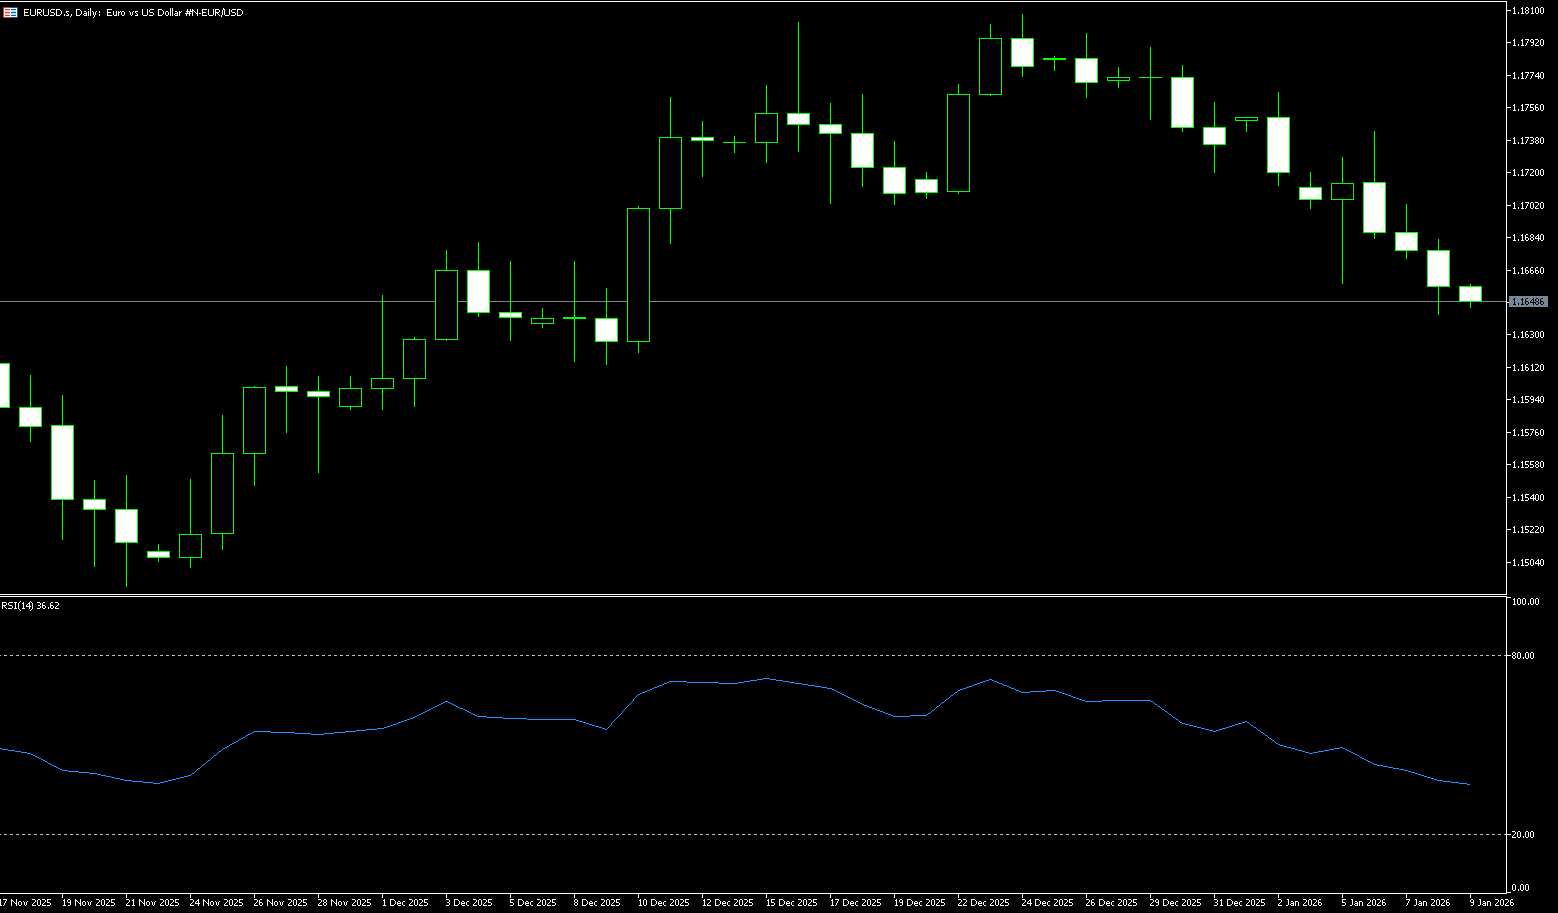
EUR/USD fluctuated around 1.1600 during last week's trading. Despite waning market bets on a Federal Reserve rate cut, the dollar faced new supply amid improved market sentiment, providing some support for the currency pair. The market is awaiting comments from Fed officials. Meanwhile, in the Eurozone, Germany's Harmonized Index of Final Consumer Prices (HICP) confirmed on Friday that December inflation fell to 0.2%, compared to 2.0% over the past 12 months, following November's -0.5% and 2.6%. The euro rebounded from its lows after the data release. The euro had fallen steadily against the dollar last week, dropping to 1.1593, its lowest level in over a month, as investors weighed Eurozone and US economic data and diverging central bank policies. The German economy is projected to grow by 0.2% in 2025, ending two years of contraction, supported by household and government consumption, although weakness in manufacturing makes the outlook fragile. Eurozone inflation slowed to 2.0% in December, returning to the ECB's target range and reinforcing expectations that interest rates will remain unchanged. ECB member François Villeroy de Gallo called expectations of a 2026 rate hike "wishful thinking" this week. In the US, stronger-than-expected retail sales supported the dollar, despite earlier data showing lower-than-expected inflation.
Last week, due to better-than-expected US data, the euro/dollar pair slid towards 1.1600, exhibiting a downward trend. It fluctuated slightly at the beginning of the week, briefly rallied mid-week before falling back, and faced significant pressure at the end of the week, breaking below several short-term moving averages, indicating a bearish technical bias. A descending channel has formed on the daily chart, with the upper boundary around 1.1680 and the lower boundary around 1.1570. The price has been trading within this channel, repeatedly encountering resistance near the upper boundary and falling back, clearly indicating a bearish pattern. While the short-term trend is downward, the medium-term outlook is one of weak consolidation. Therefore, if it fails to break through the resistance zone of 1.1667 (45-day moving average) - 1.1680 (upper boundary of the descending channel), it is highly likely to continue its downward trend towards 1.1600 (psychological level) or even lower support. If it breaks through the resistance, the 1.1674-1.1695 range should be monitored for resistance. The 14-day Relative Strength Index (RSI) remains in the 30-35 range, below the neutral line of 50, indicating a bearish trend and suggesting continued downside potential. The Moving Average Convergence Divergence (MACD) lines are below the zero line, showing signs of turning but not yet forming a golden cross, indicating that bearish momentum still dominates and rebound strength is insufficient. Meanwhile, the 14-day (1.1678) and 20-day (1.1707) moving averages are below the moving averages, with short-term moving averages arranged in a bearish pattern and the 50-day moving average flattening out. Without moving average support, the short-term trend is weak, and the medium-term outlook is one of weak consolidation. If the 1.1670-1.1680 resistance zone cannot be broken, there is a high probability of further declines towards 1.1600 or even 1.1570 (the lower trendline of the descending channel), and potentially even lower support at the 1.1500 level. On the other hand, if the 1.1670-1.1680 resistance is broken, the resistance at 1.1742 (the high of January 6th) should be monitored. The short-term target is the psychological level of 1.1800.
Today, consider going long on crude oil around 1.1590; stop loss: 1.1580; target: 1.1650; 1.1660.
Disclaimer: The information contained herein (1) is proprietary to BCR and/or its content providers; (2) may not be copied or distributed; (3) is not warranted to be accurate, complete or timely; and, (4) does not constitute advice or a recommendation by BCR or its content providers in respect of the investment in financial instruments. Neither BCR or its content providers are responsible for any damages or losses arising from any use of this information. Past performance is no guarantee of future results.
Lebih Liputan


Pendedahan Risiko:Instrumen derivatif diniagakan di luar bursa dengan margin, yang bermakna ia membawa tahap risiko yang tinggi dan terdapat kemungkinan anda boleh kehilangan seluruh pelaburan anda. Produk-produk ini tidak sesuai untuk semua pelabur. Pastikan anda memahami sepenuhnya risiko dan pertimbangkan dengan teliti keadaan kewangan dan pengalaman dagangan anda sebelum berdagang. Cari nasihat kewangan bebas jika perlu sebelum membuka akaun dengan BCR.
BCR Co Pty Ltd (No. Syarikat 1975046) ialah syarikat yang diperbadankan di bawah undang-undang British Virgin Islands, dengan pejabat berdaftar di Trident Chambers, Wickham’s Cay 1, Road Town, Tortola, British Virgin Islands, dan dilesenkan serta dikawal selia oleh Suruhanjaya Perkhidmatan Kewangan British Virgin Islands di bawah Lesen No. SIBA/L/19/1122.
Open Bridge Limited (No. Syarikat 16701394) ialah syarikat yang diperbadankan di bawah Akta Syarikat 2006 dan berdaftar di England dan Wales, dengan alamat berdaftar di Kemp House, 160 City Road, London, City Road, London, England, EC1V 2NX. Entiti ini bertindak semata-mata sebagai pemproses pembayaran dan tidak menyediakan sebarang perkhidmatan perdagangan atau pelaburan.

 English
 简体中文
简体中文
 繁體中文
繁體中文
 Bahasa
Melayu
Bahasa
Melayu
 Tiếng
Việt
Tiếng
Việt
 ไทย
ไทย
 日本語
日本語
 한국어
한국어
 ភាសាខ្មែរ
 español