


0
US Dollar Index
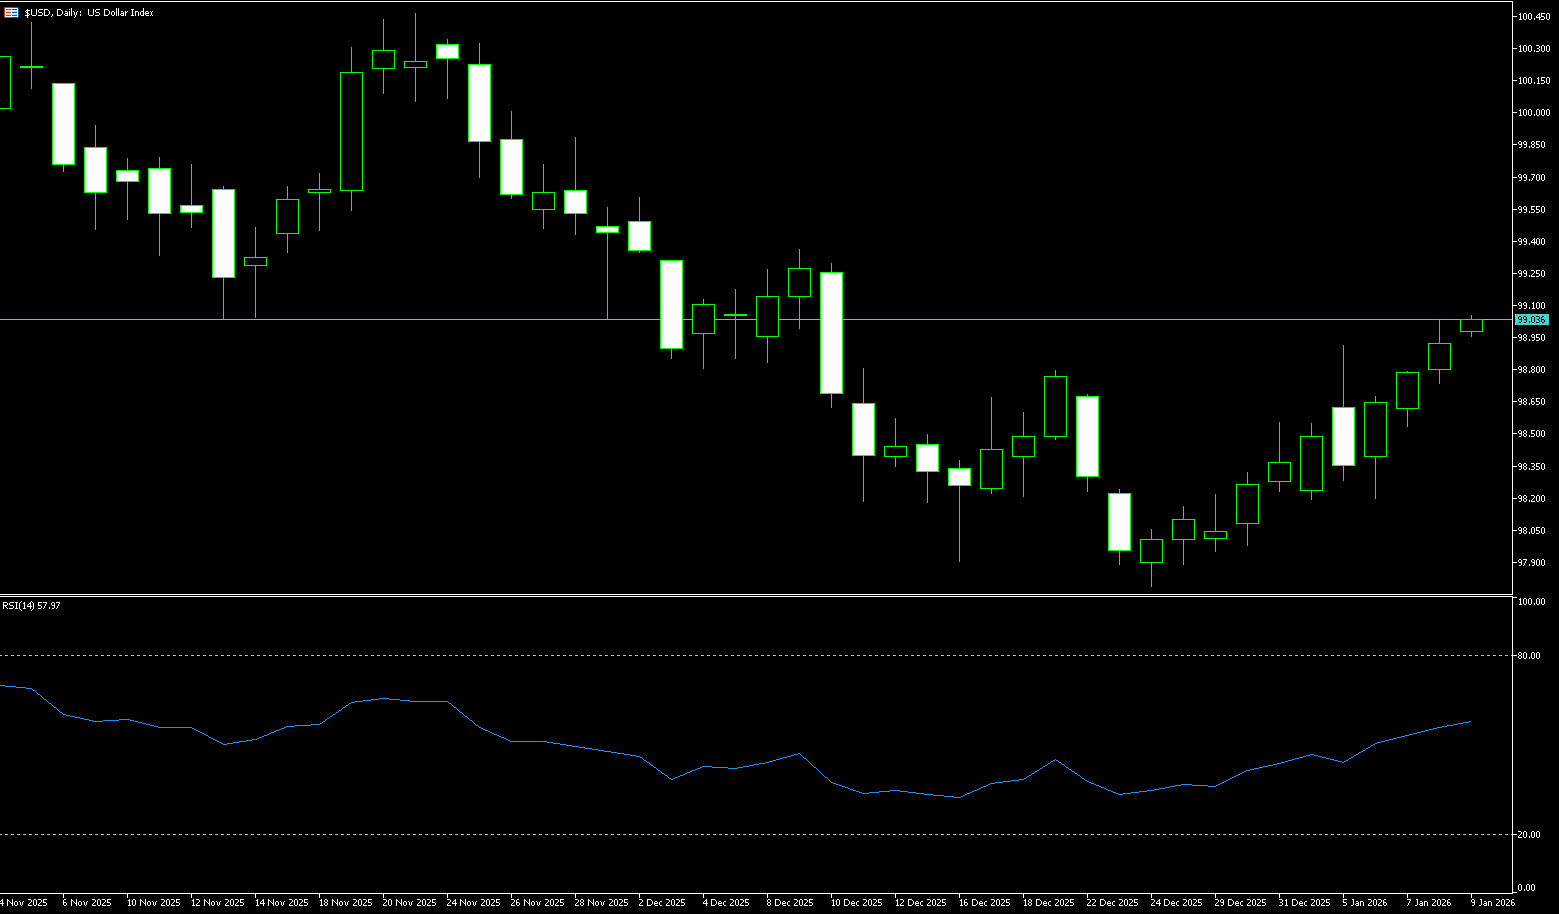
In the week ending January 17, new jobless claims in the US climbed to 200,000. According to a report released by the US Department of Labor on Thursday, the latest data was lower than the initial expectation (212,000), but still higher than the previous week's 199,000 (revised from 198,000). The US dollar continued to fall on Thursday, causing the dollar index to approach the psychologically important 98.00 level. Recently, a familiar tension has permeated the financial markets, reminiscent of the dramatic volatility known as "Liberation Day" last April. Back then, a single policy statement could trigger a precipitous revaluation of asset prices, with risk and safe-haven assets switching instantly. A similar atmosphere has resurfaced, but this time the trigger is not a tariff shock, but a deeper crisis of institutional trust. Investors' choices have become simple and direct: instead of arguing about who is right or wrong, they are directly increasing their risk discount and reducing their exposure to the US dollar and US assets. This explains the "abnormal" phenomenon of a weakening dollar and rising US Treasury yields occurring simultaneously.
The US dollar index is currently at the intersection of a "news vacuum" and a "pre-data wait-and-see period." Trump's easing of tariffs on Europe has temporarily weakened market risk aversion, but has not completely eliminated uncertainty; meanwhile, the Federal Reserve's patience regarding interest rate cuts has limited the dollar's downside. Technically, the dollar index found support around 98.50 and has stabilized and rebounded, currently in a short-term consolidation phase. The daily chart shows the index is still trading within its recent rebound channel, with momentum indicators in a neutral-to-strong range, indicating that bulls still hold some initiative. The upside resistance level to watch is the 99.20-99.50 range; a successful break above this level could open up further upside potential. On the downside, support is at 98.30; a breach of this level could lead to a retest of the 98.14 (this year's low)-98.00 (psychological level) area. Overall, the dollar index is trending sideways in the short term, and a directional move will depend on data releases.
Today, consider shorting the US Dollar Index around 98.45; Stop loss: 98.56; Target: 98.05; 98.00
WTI Crude Oil
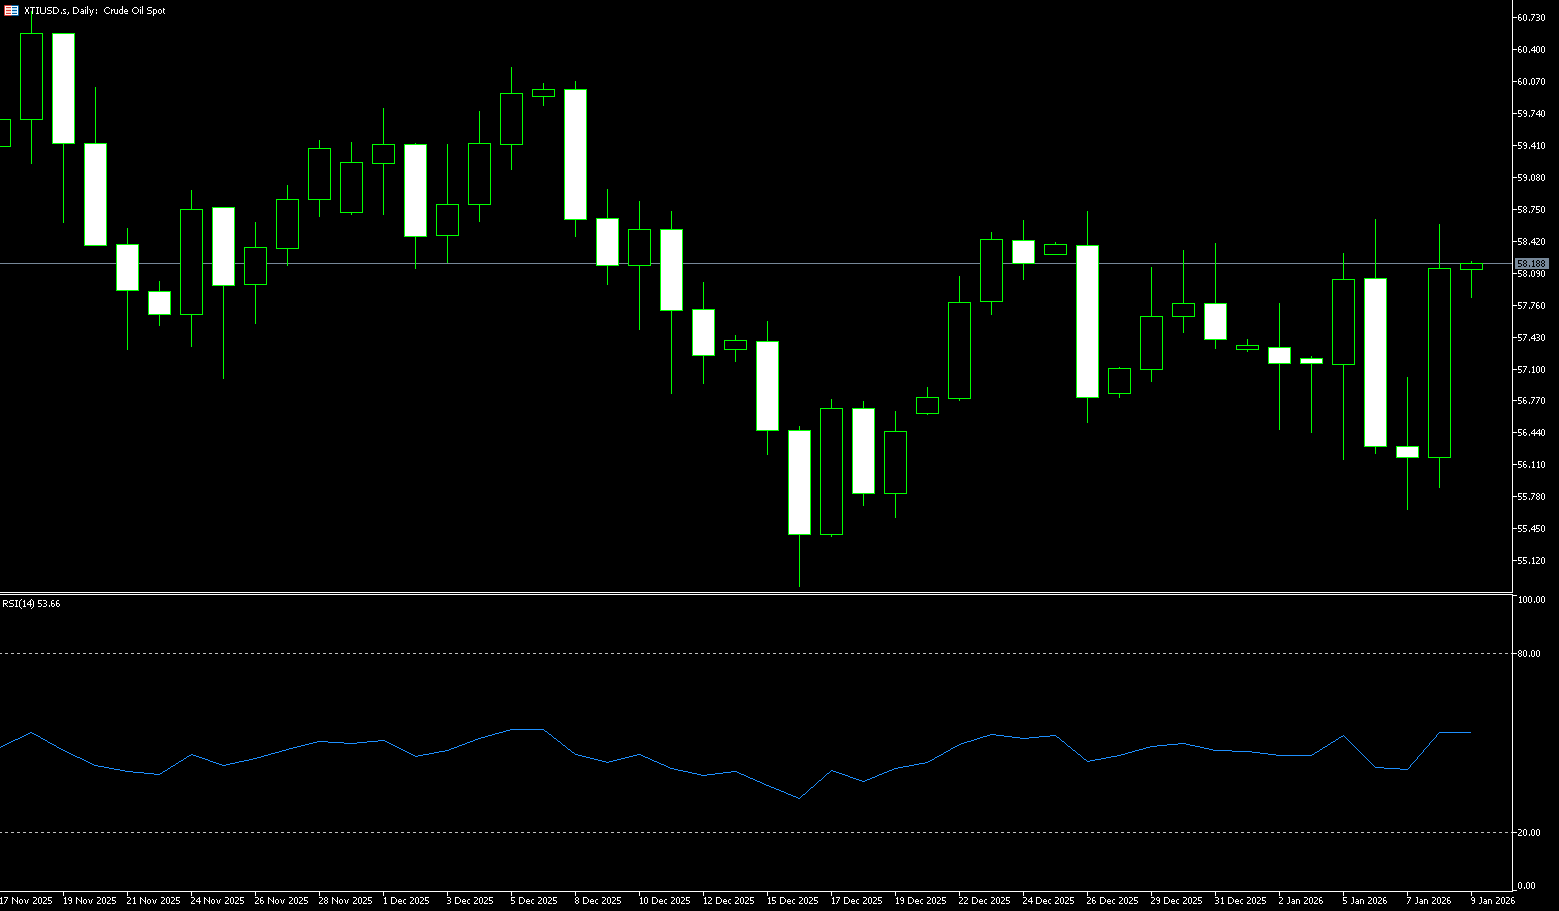
US crude oil is trading below $60.00 per barrel. Oil prices rose more than 3.6% on Wednesday, mainly supported by supply concerns stemming from production disruptions at a large oil field in Kazakhstan and slow recovery in Venezuelan exports. On the supply side, production at Kazakhstan's Tengiz oil field was suspended due to force majeure affecting pipelines supplying oil to Black Sea terminals, and the country's output is expected to be affected for another seven to ten days. Meanwhile, Venezuela's oil exports, according to an agreement with the United States, are progressing slowly, hindering its ability to fully reverse recent production cuts. On the demand side, the International Energy Agency (IEA) raised its 2026 global oil demand growth forecast in its latest report, suggesting a possible slight easing of the market's oversupply. Furthermore, geopolitical tensions continue to contribute a risk premium to the market. The market is focusing on the US crude oil inventory data to be released later for further direction.
From a technical perspective, the daily chart shows a weak and volatile trend. Oil prices are trading within a medium-term downtrend channel, and previous rebounds have repeatedly met resistance near key moving averages and previous highs, indicating continued selling pressure. The overall chart is bearish, with short-term moving averages providing resistance, and a clear trend reversal signal remains unclear. In terms of momentum indicators, the RSI remains in the lower-neutral range, failing to effectively enter the strong zone, suggesting that the current rebound is more of a technical correction than a trend reversal. If prices fail to hold above the key area of $60, a retest of $58.42 (the 50-day moving average) and $57.50 is possible. Conversely, only a breakout of this important resistance zone with accompanying trading volume could open up further upside potential, potentially reaching the short-term resistance zone around $61.23 (the high of January 13th), with a break below that targeting $62.19 (the high of January 14th).
Today, consider going long on crude oil around 59.23; Stop loss: 59.05; Target: 60.50; 60.70
Spot Gold
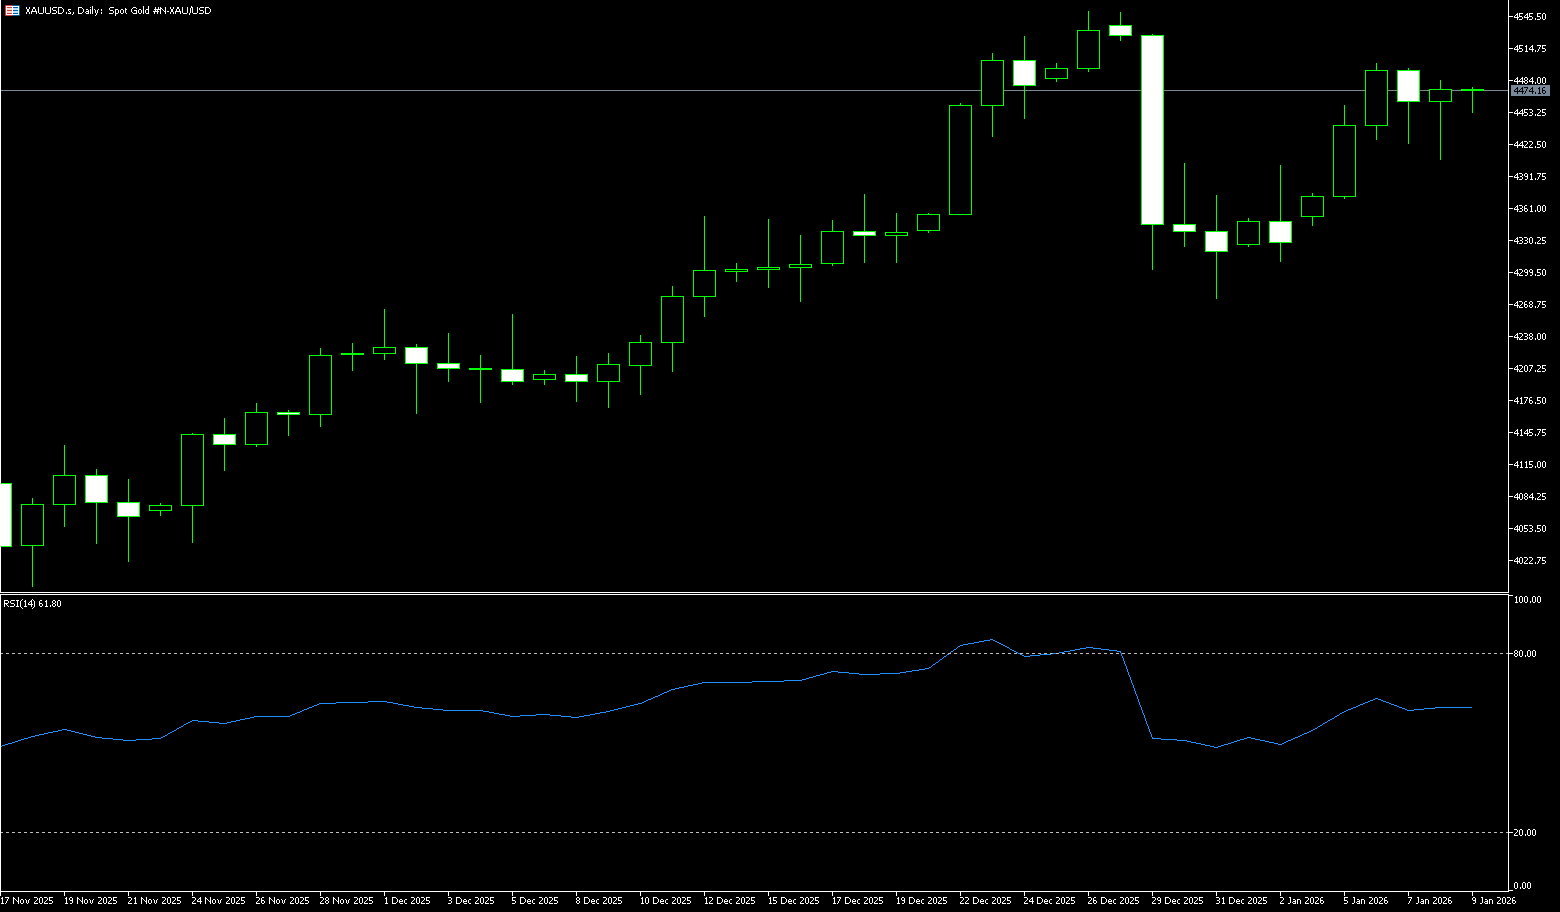
Gold continued its impressive rally on Thursday, breaking through the $4,900 per ounce mark to reach a new high of $4,919.60, all thanks to a significant pullback in the US dollar. This shift occurred despite improved global risk appetite, driven by a change in Trump's stance on Greenland, which helped ease broader geopolitical tensions. Gold prices narrowed gains after hitting a record high of $4,888.50 per ounce on Wednesday, with trade war concerns dominating global markets and pushing gold to new price peaks. Coupled with bond market turmoil and fiscal concerns in major economies, this further exacerbated risk aversion in global markets. Even though momentum indicators showed clear overbought signals, spot gold maintained strong buying support, highlighting its core safe-haven asset attributes. Amidst escalating geopolitical conflicts and economic uncertainty, gold has become a core asset class for investors seeking to hedge risks, resulting in persistently high demand.
From a technical perspective, although momentum indicators show long-term overbought signals, the short-term MACD line and histogram are healthy with no divergence, suggesting continued strong buying support for spot gold. After breaking through the key resistance level of $4,500, gold prices have formed a healthy "breakout-pullback-re-rise" pattern, with the moving average system in a bullish alignment and continuously increasing volume, attracting significant trend-following funds and further strengthening the upward momentum. Hedge funds and other professional investors continue to increase their net long positions in gold, without showing signs of overcrowding, leaving room for further price increases. On the upside, the $4,950 level is worth watching, and even a move towards $5,000/ounce is possible. On the downside, the $4,800 (psychological level) and $4,772 (Thursday's low) levels are worth considering.
Consider going long on gold around 4,910 today; Stop loss: 4,905; Target: 4,960; 4,970
AUD/USD
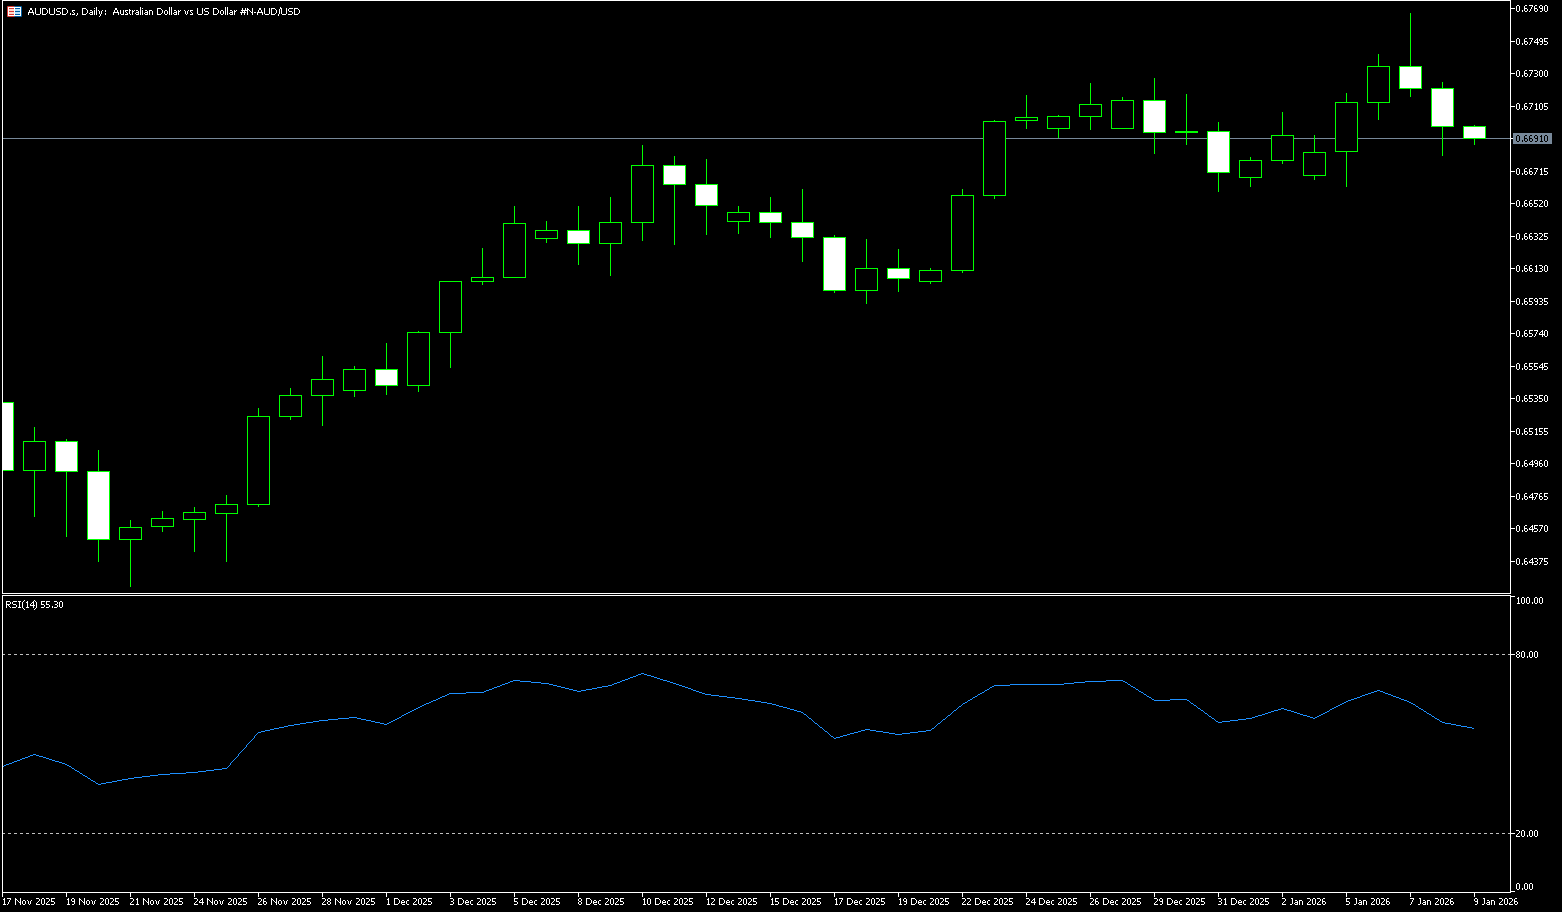
The AUD/USD pair maintained its bullish bias on Thursday, marking the fourth consecutive day of gains, and significantly surpassed the 0.6800 level, its highest level since October 2024. The continued rise in the Australian dollar was driven by a weaker US dollar and solid results from the Australian labor market report. The Australian dollar strengthened against the US dollar on Thursday after seasonally adjusted employment data from Australia reinforced market expectations of a tightening of monetary policy by the Reserve Bank of Australia. Data released by the Australian Bureau of Statistics showed that Australia's employment changed by 65,200 in December, a significant rebound from 28,700 in November, compared to a market consensus forecast of 30,000. Meanwhile, the unemployment rate fell from 4.3% to 4.1%, below the market consensus of 4.4%. Sean Creek, head of labor statistics at the ABS, stated that the increase in employment among those aged 15 to 24 this month drove overall employment growth and a decline in the unemployment rate.
The Australian dollar/US dollar pair traded around 0.6840 on Thursday. Daily chart analysis shows the pair rising within an ascending channel pattern, indicating a continued bullish bias. Furthermore, the 9-day simple moving average (SMA) is above the daily SMA, further reinforcing the bullish tone. This alignment maintains upward pressure. Meanwhile, the 14-day Relative Strength Index (RSI) on the daily chart is at 76.69, indicating overbought conditions and that momentum has been stretched. The pair is testing immediate resistance at approximately 0.6852, the high from October 4, 2024, followed by the 0.6900 level. A further break above this level would target 0.6950. On the downside, key support lies at 0.6800 (a psychological level) and the 5-day SMA at 0.6740. A break below the short-term moving average would weaken price momentum, targeting the 0.6700 level.
Consider going long on the Australian dollar today around 0.6830; Stop loss: 0.6820; Target: 0.6870; 0.6880
GBP/USD
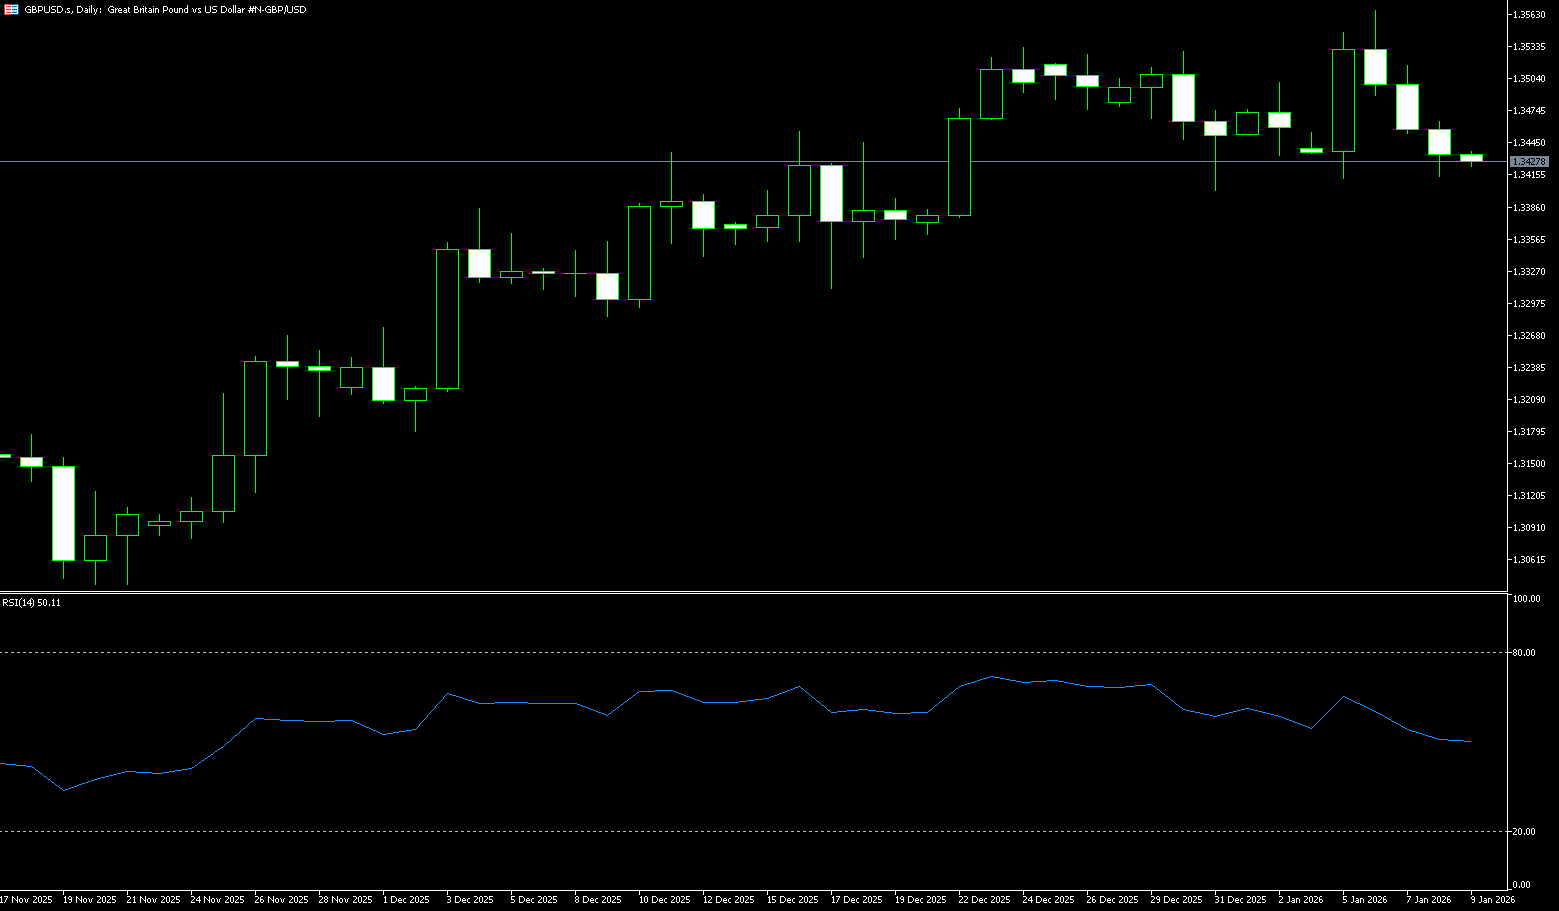
GBP/USD regained momentum on Thursday and advanced towards a two-week high near 1.3500. In the process, the pound shook off Wednesday's brief volatility and returned to an upward trend, supported by continued selling pressure on the dollar ahead of Friday's key leading PMI data. Currently, the pound is in a dilemma. On the one hand, inflation remains above target, limiting the potential for a significant decline; on the other hand, deeply ingrained expectations of interest rate cuts limit the possibility of a strong rebound. The key to breaking out of this consolidation will still be a trend that supports inflation. Only after seeing a stable decline for several consecutive months will the market lower its expectations for the magnitude of interest rate cuts, thereby easing the interest rate differential pressure on the pound.
The pound extended its upward trend mid-week, holding above the 200-day and 20-day simple moving averages at 1.3409 and 1.3452 respectively, as the dollar pared some earlier losses. Buyers remained dominant, as the 14-day Relative Strength Index (RSI) showed a bullish bias, indicating a price trend reversal. If GBP/USD breaks decisively above the psychological level of 1.3500, the next key resistance level will be the January 6 peak at 1.3567. A break above the latter would expose the psychological level of 1.3600. Conversely, if the pair falls below the 20-day simple moving average at 1.3452 and the psychological level of 1.3400, the next support level will be Monday's low of 1.3344.
Consider going long on GBP/USD around 1.3495 today; Stop loss: 1.3485, Target: 1.3550; 1.3555
USD/JPY
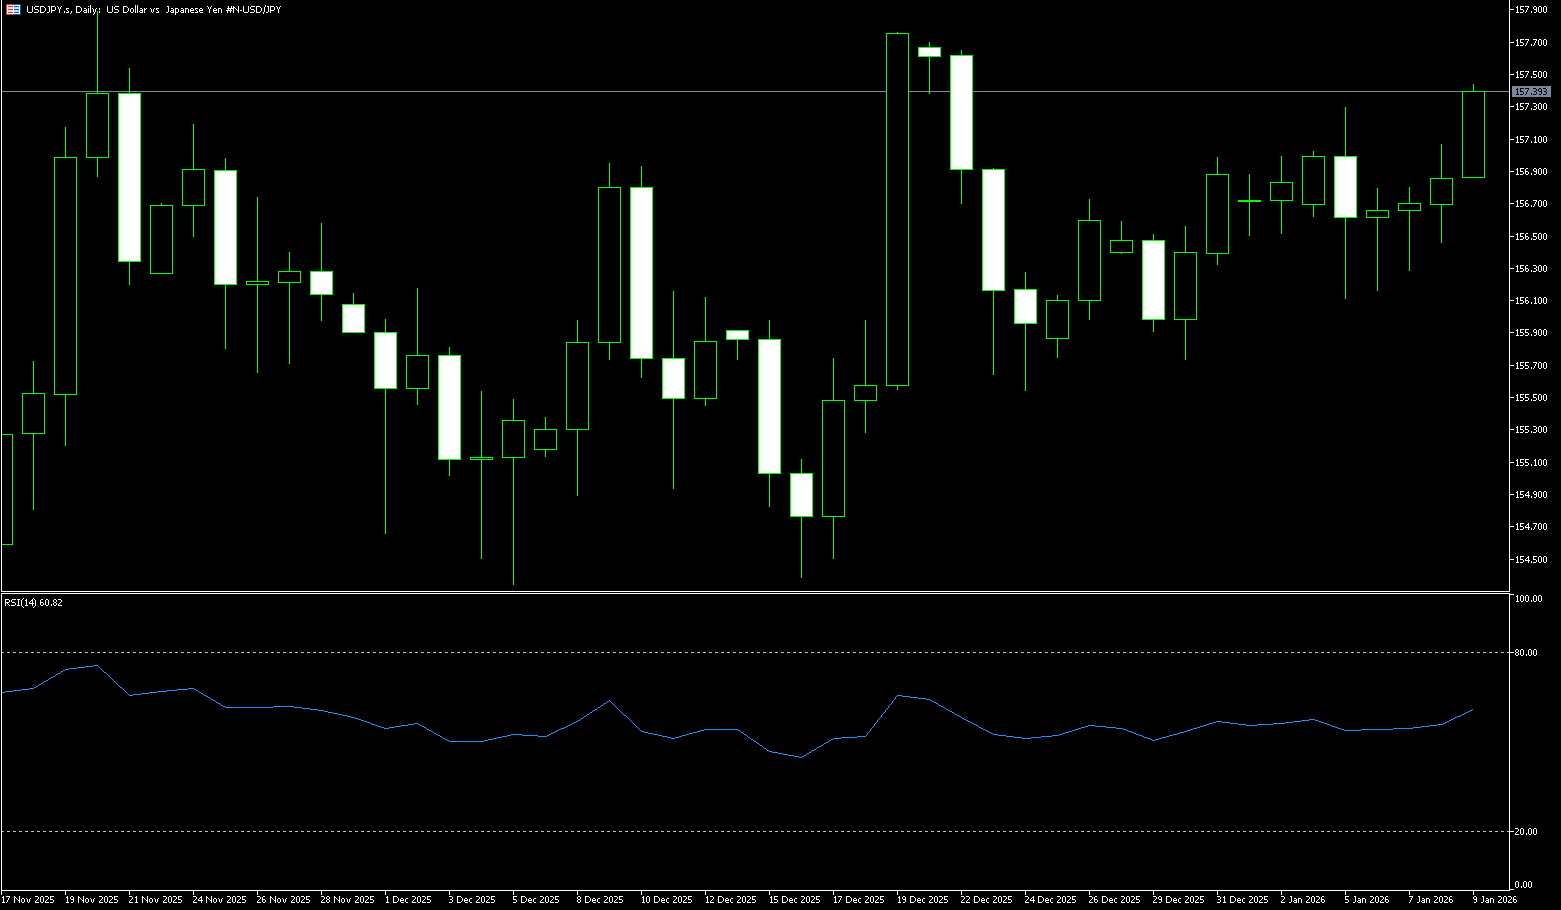
On Thursday, the yen appeared to be trading within a narrow range against the dollar, with a mixed fundamental outlook. Global market risk sentiment was significantly boosted by US President Donald Trump's shift in stance on Greenland, weakening demand for traditional safe-haven assets, including the yen. Prime Minister Sanae Takaichi announced a snap election and pledged more accommodative fiscal measures, including a proposal to eliminate the 8% sales tax on food. Meanwhile, the market widely expects the Bank of Japan to keep its policy rate unchanged at 0.75% on Friday, following a rate hike in December. Traders remained wary of potential yen intervention due to concerns about the impact of a weaker currency on domestic inflation. On the data front, Japanese exports rose for the fourth consecutive month in December to a record high, supported by stable demand from China despite ongoing diplomatic tensions. Despite a decline in shipments to the US for the first time since the pandemic due to trade policy challenges, exports are still projected to increase for the whole of 2025.
The recent USD/JPY exchange rate reflects the interplay between fundamentals and policy risks. Short-term support comes from expectations of tightening by the Bank of Japan and safe-haven inflows, while fiscal pressure and bond market volatility limit further upside. Technically, USD/JPY is currently facing resistance at the 159.00 level (a psychological level), with the pair continuing to oscillate below 159, indicating a short-term bearish bias. The MACD and signal lines are near the zero line, suggesting limited momentum. The RSI is neutral, lacking a clear direction. If the pair fails to break through key resistance levels at 159.00 (a psychological level) and 159.45 (the high of January 14th), sellers will remain in control, limiting upside potential. On the other hand, USD/JPY is expected to continue its depreciation trend within an upward channel, with support at the 157.00 level, followed by the 156.50 level (the 50-day simple moving average).
Consider shorting the US dollar around 158.60 today; Stop loss: 158.80; Target: 157.80; 157.60
EUR/USD
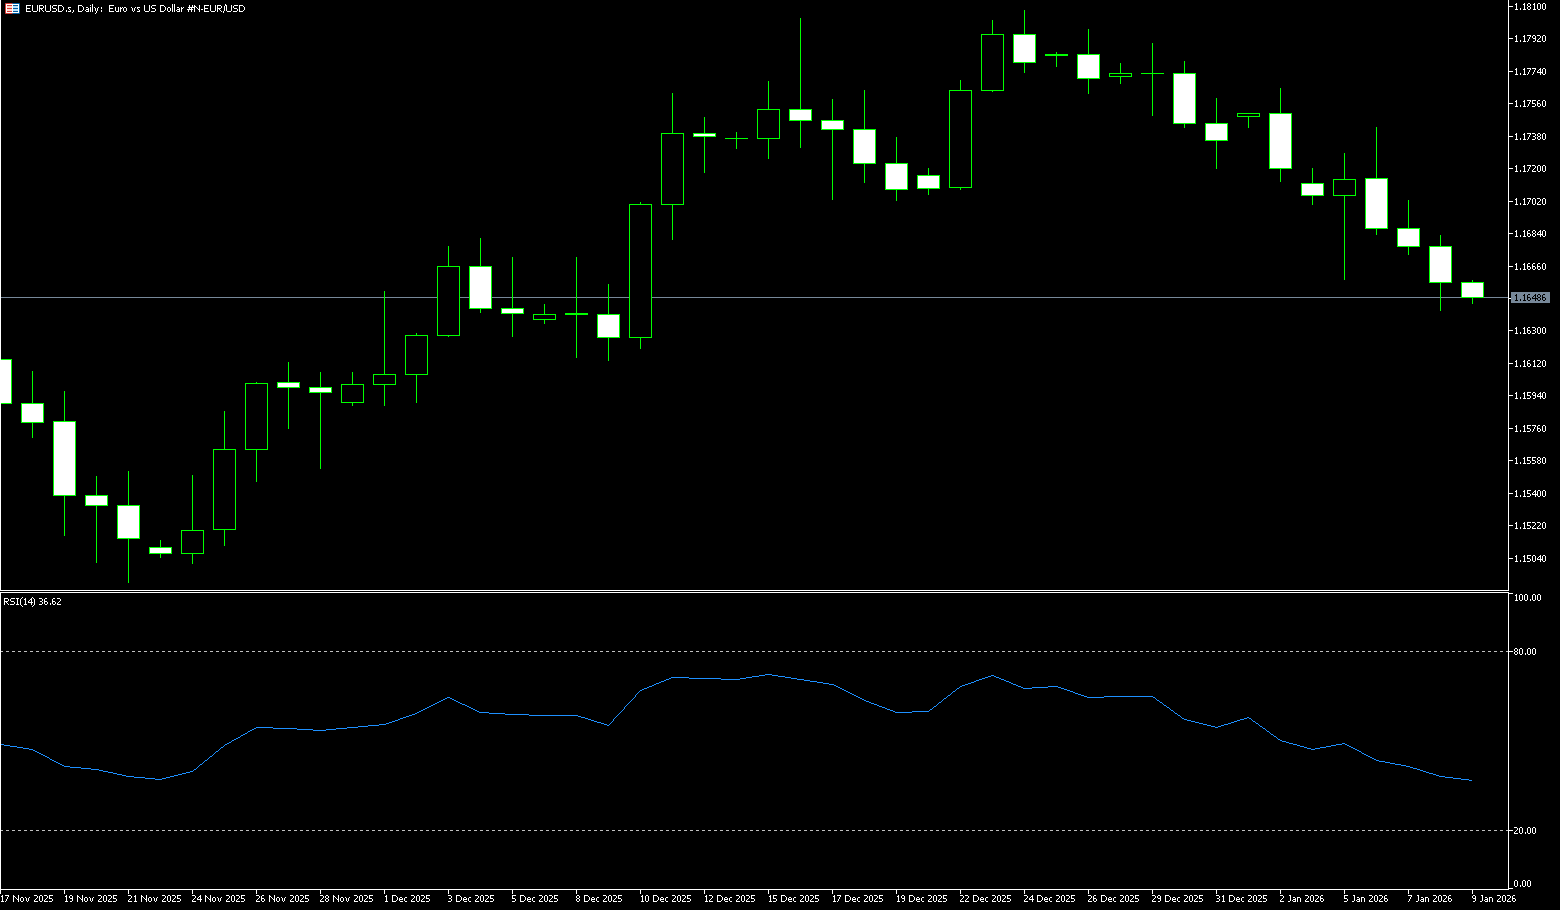
The EUR/USD pair stabilized near its two-day high of 1.1750 as Thursday's trading drew to a close. The pair was supported by more constructive risk sentiment, benefiting from easing trade tensions between the EU and the US and a weaker dollar. Looking ahead, market focus shifts to Friday's release of preliminary PMI data from Europe and the US. Following consecutive gains in the EUR/USD pair, investors digested comments from US President Trump at the World Economic Forum in Davos, while geopolitical tensions persisted. Trump reiterated his intention to acquire Greenland but ruled out the possibility of forcibly occupying the Arctic island. However, tensions remain high as the European Parliament's trade committee indefinitely postponed its vote on approving the US trade agreement, reflecting growing unease in Europe about Trump's ambitions. On the policy front, signs of resilience in the Eurozone economy and near-target inflation support market expectations that the European Central Bank is likely to maintain current interest rates for the foreseeable future.
The euro/dollar pair touched a daily high of 1.1756 and broke above 1.1700, opening a path to higher levels. The 14-day Relative Strength Index (RSI) on the daily chart shows bullish momentum. Therefore, in the short term, the pair may test higher levels. If the pair climbs above 1.1750, the first resistance level will be 1.1768 (Tuesday's high), followed by the psychological level of 1.1800. A break above this level would target 1.1848 (the high from September 18th last year). Conversely, if the euro/dollar falls below the psychological level of 1.1700, the next support level will be the 5-day simple moving average at 1.1681, followed by the 200-day simple moving average at 1.1591.
Consider going long on the Euro today around 1.1742; Stop loss: 1.1730; Target: 1.1785; 1.1790
Disclaimer: The information contained herein (1) is proprietary to BCR and/or its content providers; (2) may not be copied or distributed; (3) is not warranted to be accurate, complete or timely; and, (4) does not constitute advice or a recommendation by BCR or its content providers in respect of the investment in financial instruments. Neither BCR or its content providers are responsible for any damages or losses arising from any use of this information. Past performance is no guarantee of future results.
更多報導


風險披露:衍生品在場外交易,採用保證金交易,意味著具有高風險水平,有可能會損失所有投資。這些產品並不適合所有投資者。在進行交易之前,請確保您充分了解風險,並仔細考慮您的財務狀況和交易經驗。如有必要,請在與BCR開設帳戶之前諮詢獨立的財務顧問。
BCR Co Pty Ltd(公司編號1975046)是一家依據英屬維京群島法律註冊成立的公司,註冊地址為英屬維京群島托爾托拉島羅德鎮Wickham’s Cay 1的Trident Chambers,並受英屬維京群島金融服務委員會監管,牌照號碼為SIBA/L/19/1122。
Open Bridge Limited(公司編號16701394)是一家依據2006年《公司法》註冊成立並在英格蘭及威爾斯註冊的公司,註冊地址為 Kemp House, 160 City Road, London, City Road, London, England, EC1V 2NX. 本公司僅作為付款處理方,並不提供任何交易或投資服務。

 English
 简体中文
简体中文
 繁體中文
繁體中文
 Bahasa
Melayu
Bahasa
Melayu
 Tiếng
Việt
Tiếng
Việt
 ไทย
ไทย
 日本語
日本語
 한국어
한국어
 ភាសាខ្មែរ
 español