0
Currency & Commodity Analysis:
US Dollar Index:
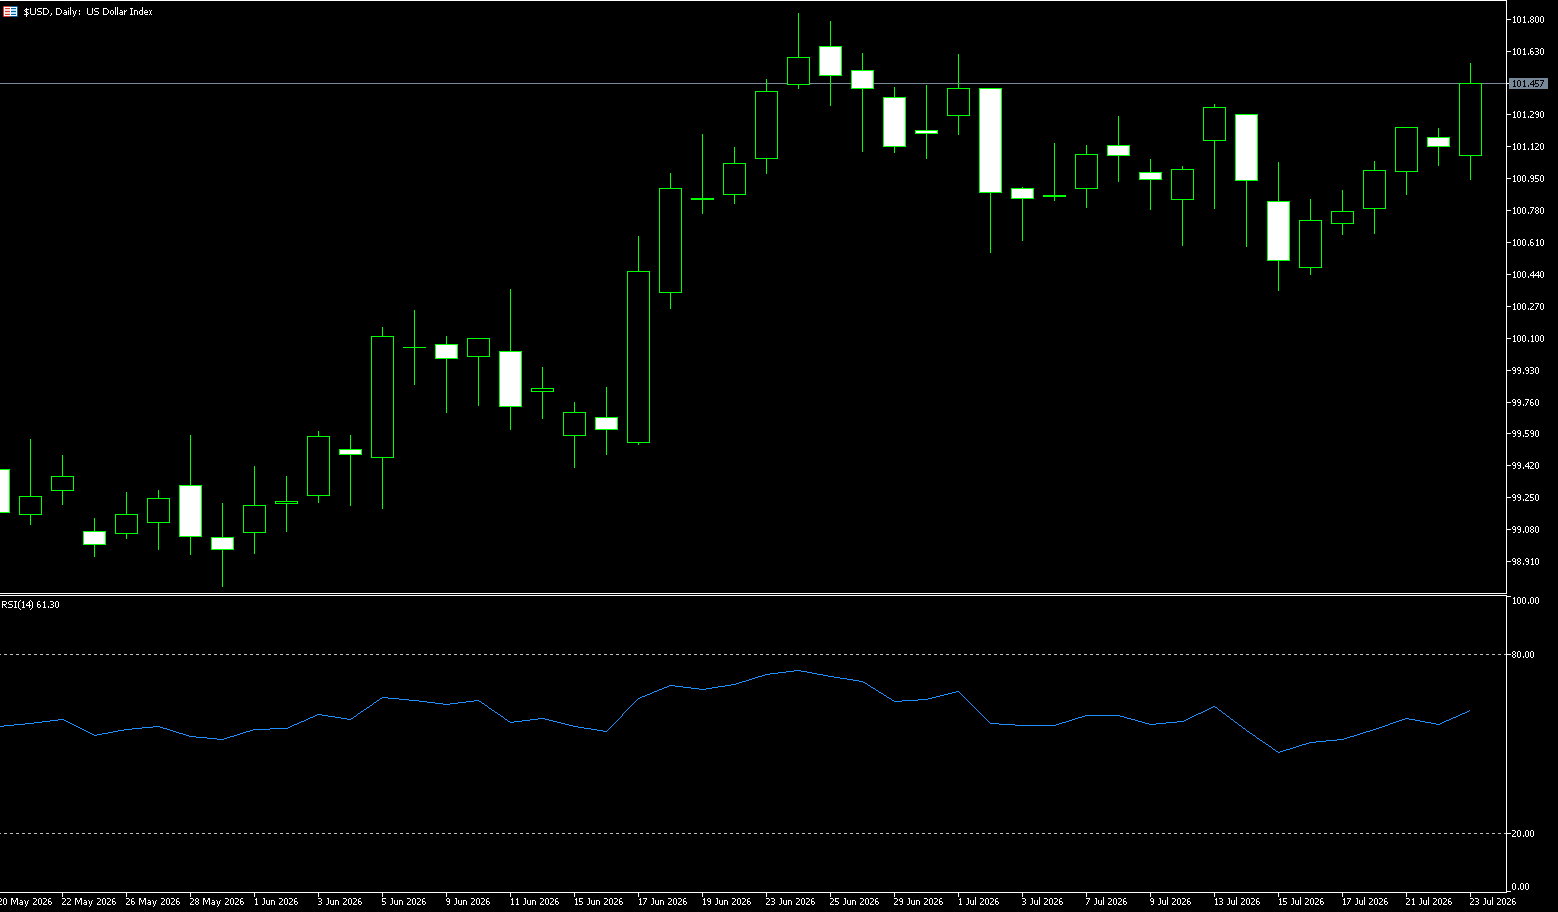
The US dollar index rose to 101.55 on Thursday, its highest level in nearly three weeks, driven by soaring oil prices and escalating geopolitical tensions, pushing market expectations that the Federal Reserve will need to raise interest rates. The market currently expects a greater than 33% probability of a rate hike next week, while the probability of a rate hike in September has risen to 78%, up from 61% the previous day. The escalating hostilities in the Middle East show no signs of resolution in the near term. Consequently, oil prices have surged nearly 31% from pre-conflict levels earlier this month. While inflationary pressures have remained relatively moderate so far, the latest energy price spike has reignited concerns that higher oil prices could drive broader inflation, prompting the Federal Reserve to maintain a tighter monetary policy stance. The dollar rose against the euro after the European Central Bank kept interest rates unchanged as expected, and also strengthened against the yen and pound.
Currently, the dollar is not experiencing a typical one-sided safe-haven rally because several macroeconomic factors are offsetting each other. Escalating conflict typically creates liquidity demand, boosting the dollar's short-term safe-haven appeal; however, if oil prices continue to rise, US import costs and inflation expectations will also increase simultaneously, pushing up long-term interest rates and fiscal financing pressures. In this scenario, the dollar may initially be supported by yields, but subsequently constrained by real growth expectations and asset valuation adjustments. The dollar index is currently trading slightly below 101, indicating that the market is temporarily viewing geopolitical risks as a manageable disturbance rather than a global liquidity crisis. The 101.55 level represents this week's rebound high, while 101.80 corresponds to a stronger resistance zone around the June 24th high. On the downside, 100.55 and 100.35 form a short-term low. The price structure is closer to event-driven range compression than the start of a trend.
Consider shorting the US Dollar Index at 101.55 today, with a stop-loss at 101.65 and targets at 101.10 and 101.00.
WTI Crude Oil
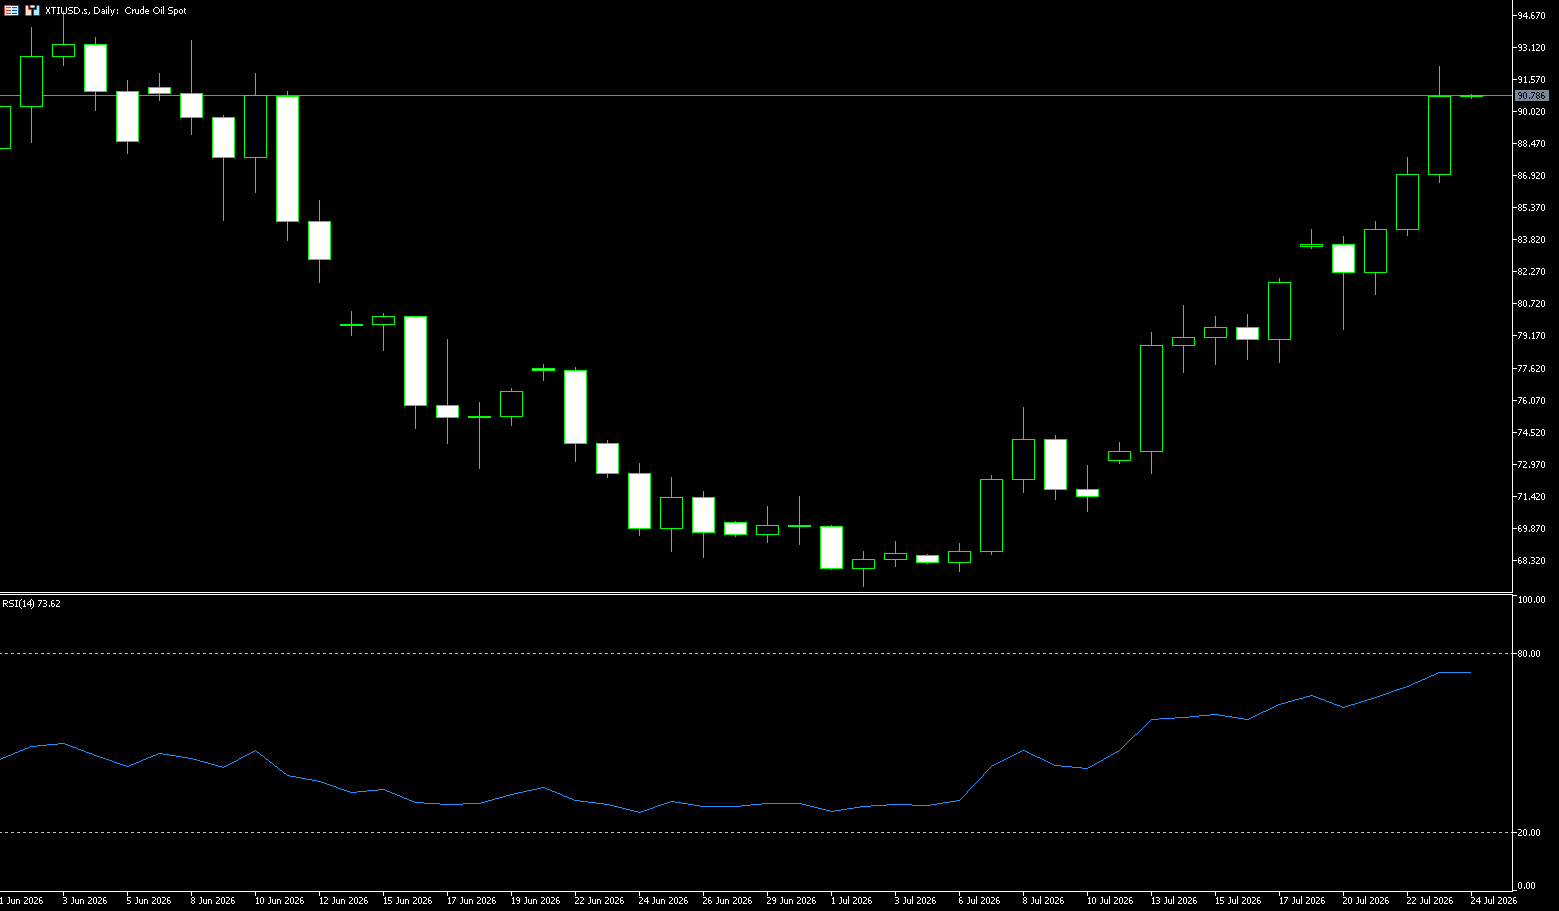
Crude oil prices rose more than 6% on Thursday, trading above $92 a barrel, marking their fifth consecutive day of gains and reaching their highest level since early June, as escalating hostilities in the Middle East heightened concerns about disruptions to global supply. US President Trump warned that the United States would be responsible for any future Houthi attacks on commercial shipping in the Red Sea, threatening "significant military punishment" for militants in Tehran and Yemen. He also stated that he was "considering a large-scale attack on Iran." These comments came after Houthi attacks on two Saudi oil tankers, which the group said were aimed at enforcing a newly announced blockade of Saudi ports. Oil prices have now risen more than 30% from pre-conflict levels earlier this month. Market supply concerns were further exacerbated by Kazakhstan's decision to suspend crude oil exports through the Union Terminal of the Caspian Pipeline following a drone attack.
Taken together, the actual traffic obstructions in the Red Sea and the Strait of Hormuz, the substantial increase in logistics costs, and the expectation of substantial tightening on the supply side have built a very solid bottom support for oil prices. For traders, before the maritime logistics chain is truly unimpeded and the geographical blockade is completely lifted, any short-term correction caused by positive diplomacy will be more likely to be viewed by the bulls in the physical market as a bargaining chip exchange rather than a bearish trend signal. Technically, WTI crude oil has recently gapped up and exceeded the gap caused by the previous decline. Afterwards, it filled the gap and continued to rise, while breaking through the 50-day moving average. The current pressure is around US$92.25 {Thursday high}, and US$94.86 {June 3 high}, and the support is near US$86.58 {Thursday low}, and US$85.02 {5-day moving average}.
Today, consider going long on crude oil at 90.80, with a stop-loss at 90.60 and targets at 93.00 and 94.00.
Spot Gold
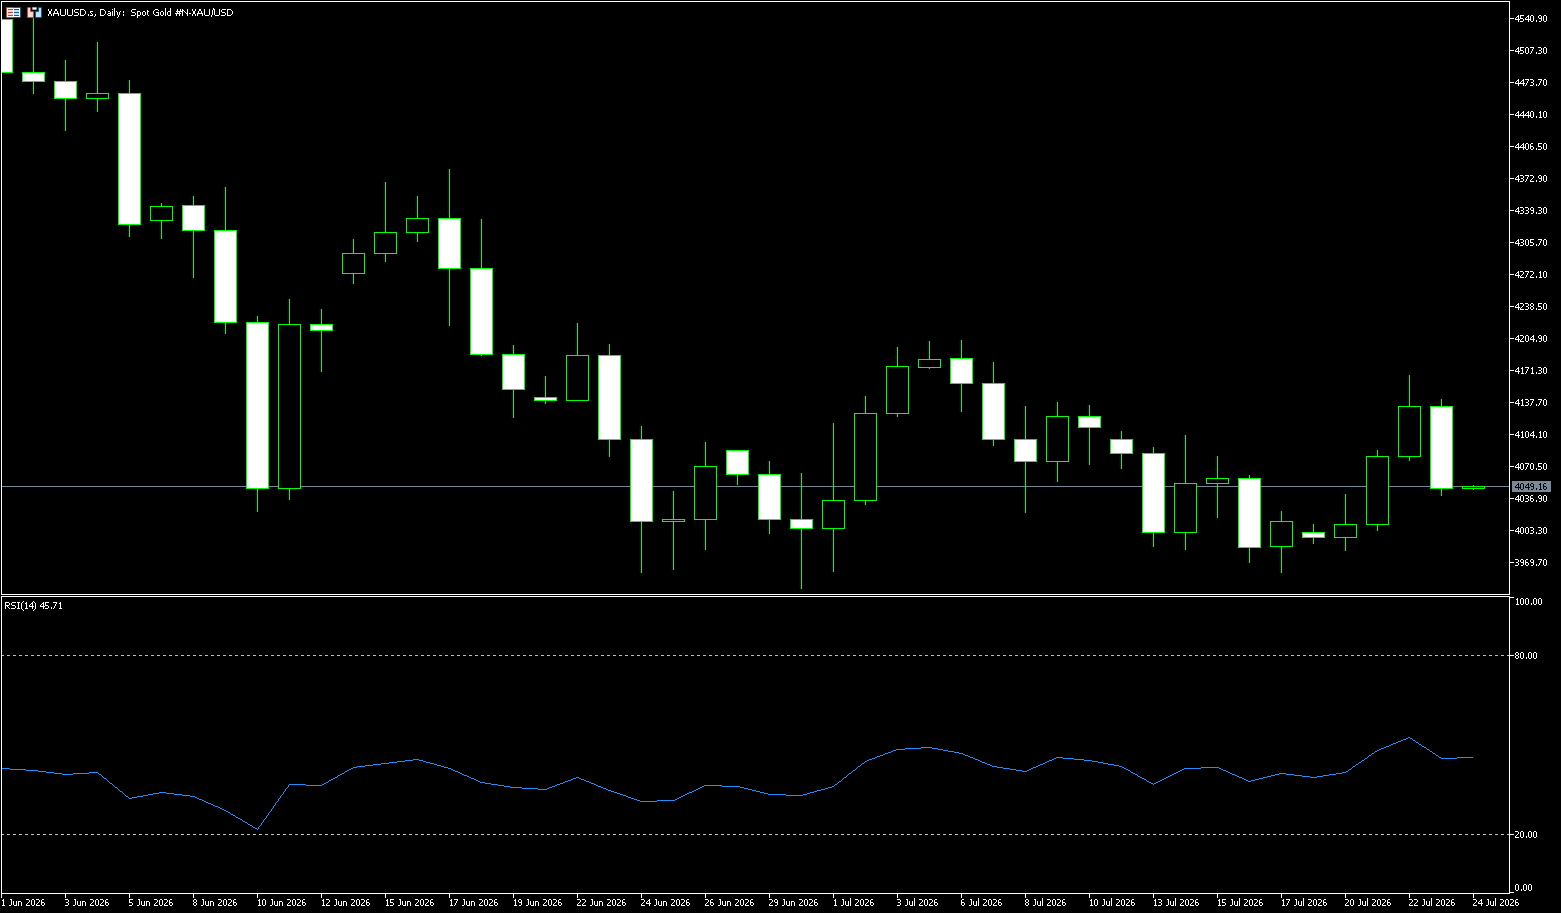
Gold prices fell below $4,100 an ounce on Thursday, retreating from a two-week high, as escalating tensions in the Middle East pushed up oil prices and heightened market expectations of a possible Federal Reserve rate hike later this year. The Iranian-backed Houthi rebels said they had attacked two Saudi oil tankers as part of a naval blockade, raising concerns about a potential new bottleneck in global oil supplies. Meanwhile, the US conducted its twelfth consecutive night of airstrikes against Iran, prompting further retaliation and exacerbating fears of a prolonged disruption to Gulf energy exports. Higher oil prices have fueled inflation concerns, leading investors to expect the Federal Reserve to maintain a tight monetary policy for a longer period, a backdrop that typically puts pressure on non-yielding assets such as gold. The currency market currently prices a roughly 78% probability of a Fed rate hike in September.
Gold prices stalled a week-long uptrend near the $4,155-$4,165 confluence zone, which includes the 200-period exponential moving average on the 4-hour chart and the 23.6% Fibonacci retracement level of the April-June decline. This area should now be a key level for short-term traders, as momentum indicators are constructive. The Relative Strength Index (RSI) is hovering around 46, and the MACD remains positive, suggesting that buyers still have some control, but are constrained by supply pressure above. This, in turn, suggests that the precious metal first needs to break through the aforementioned dense resistance zone to support the argument for further gains. A sustained break above this zone would pave the way for a further challenge of the $4,100 psychological level and the resistance near the 23.6% Fibonacci retracement level of $4,164.97. On the downside, key structural support is at $4,000 (a psychological level), followed by $3,982 (Monday's low). This area could become a demand zone for a deeper pullback and an attempt to rebuild a more solid base for gold.
Consider going long on gold today at 4,045, with a stop loss at 4,040; targets: 4,080; 4,090.
AUD/USD
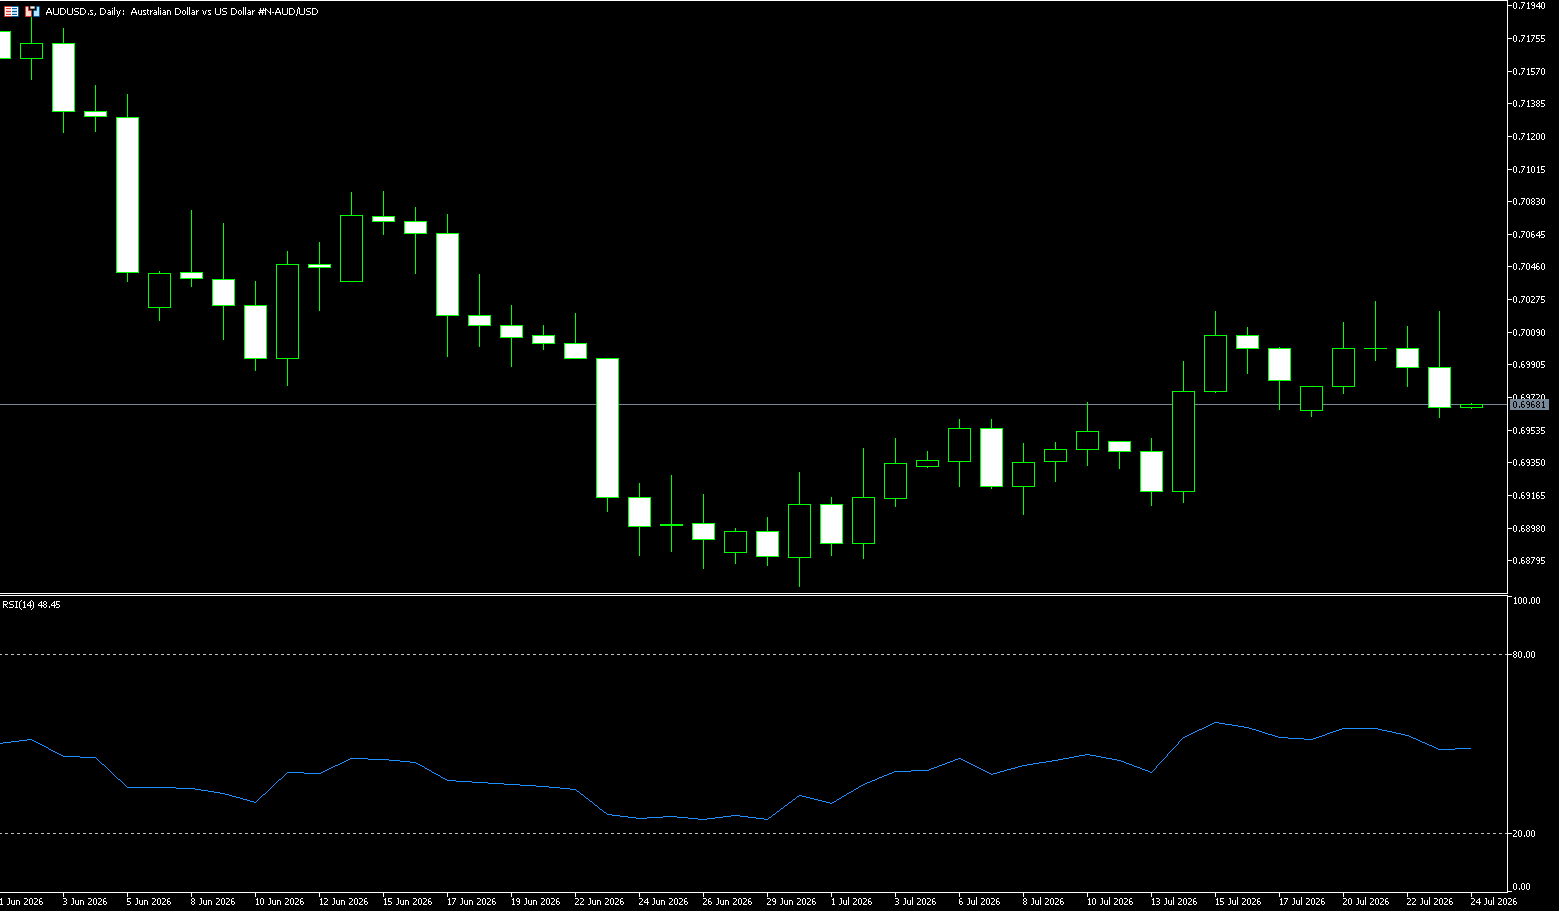
The Australian dollar rose above US$0.70, reaching its highest point in five weeks, as a stronger-than-expected labor market report strengthened expectations of another interest rate hike. Net employment surged by 76,300 in June, the largest increase since April last year, far exceeding the predicted increase of 15,300, while the unemployment rate remained at 4.4% as expected, and the participation rate rose to a one-year high of 67%. Optimistic data reinforced signs of a tight labor market and prompted the market to raise the probability of another rate hike at the end of the year to 90%, up from 78% previously. Coupled with renewed conflict in the Middle East leading to higher oil prices, the strong jobs report increased uncertainty about the inflation outlook and put more pressure on the Reserve Bank of Australia to maintain policy restraint. Investors are now awaiting second-quarter inflation data next week, with core inflation expected to accelerate to 3.7% from 3.5%, still well above the central bank's 2%-3% target range.
From a technical perspective, spot prices are above the 38.2% Fibonacci retracement level of the decline from 0.7200 (the high at the end of May) and the 100-period exponential moving average on the 4-hour chart at 0.6957, maintaining a mild short-term bullish bias. Furthermore, the Relative Strength Index (RSI) is at 56, confirming the positive outlook and not showing overbought conditions; however, the MACD histogram is flattening below the zero line, suggesting positive but weak upward momentum. Therefore, any subsequent rise is likely to encounter initial resistance at the 50.0% Fibonacci retracement level of 0.7033. Furthermore, the 61.8% Fibonacci retracement level of 0.7072 should be the next hurdle in the current rally sequence; on the downside, short-term support is seen at the 38.2% retracement level of 0.6993, followed by the 100-period EMA at 0.6957. A further pullback could target the psychological level of 0.6900.
Consider going long on the Australian dollar today at 0.6955, with a stop-loss at 0.6945 and targets at 0.7000 and 0.7010.
GBP/USD
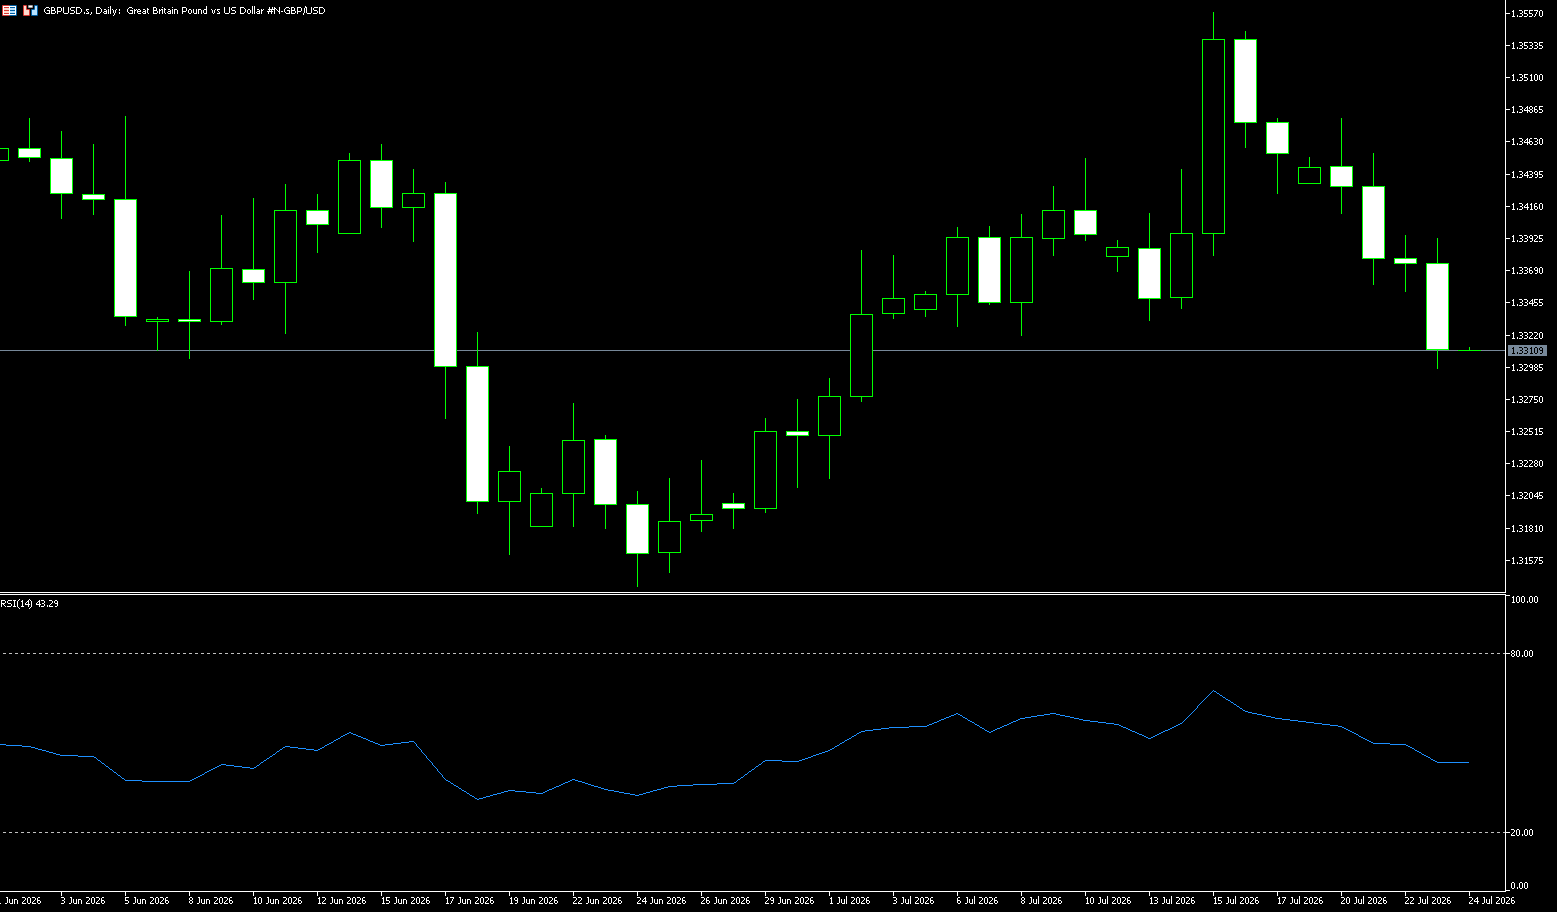
The pound remained below $1.3350, its lowest level in over a week, after UK inflation slowed more than expected, reducing the prospect of a Bank of England rate hike this month. Annual inflation fell to 2.6% in June, the lowest level since March 2025, below the expected 2.7%, mainly driven by declines in transport and food prices. However, core inflation (2.6%) and service inflation (3.6%) were both slightly higher than expected. Businesses remained cautious, and inflation could rise again in the coming months. Meanwhile, new Chancellor of the Exchequer John Healy welcomed the slowdown in inflation data but said more support was needed after the government announced a series of measures, including a reduction in VAT on electricity bills and a cap of £2 on single bus fares across England from January. Elsewhere, tensions escalated in the Middle East, with President Trump warning of further strikes and pledging retaliation if Iranian-backed Houthi rebels disrupt shipping in the Red Sea.
The pound/dollar was trading at 1.3320. The currency pair broke through the downtrend resistance line from the May high but remains capped below the 200-day simple moving average at 1.3399. Momentum indicators on the daily chart are neutral to bullish, with the 14-day Relative Strength Index (RSI) hovering above 50 and the MACD in positive territory. However, the aforementioned 200-day simple moving average around 1.3399 could be a difficult level to break. A break above this level would target the highs of June 15th and July 10th, around 1.3455. On the downside, the bottom of the trading range over the past two weeks at 1.3300 could pose a challenge for bears. Further down, the broken trendline now at 1.3290, and the highs of June 22nd and 30th around 1.3270, will be the next targets.
Today, consider going long on GBP at 1.3310, with a stop-loss at 1.3300 and targets at 1.3360 and 1.3370.
USD/JPY
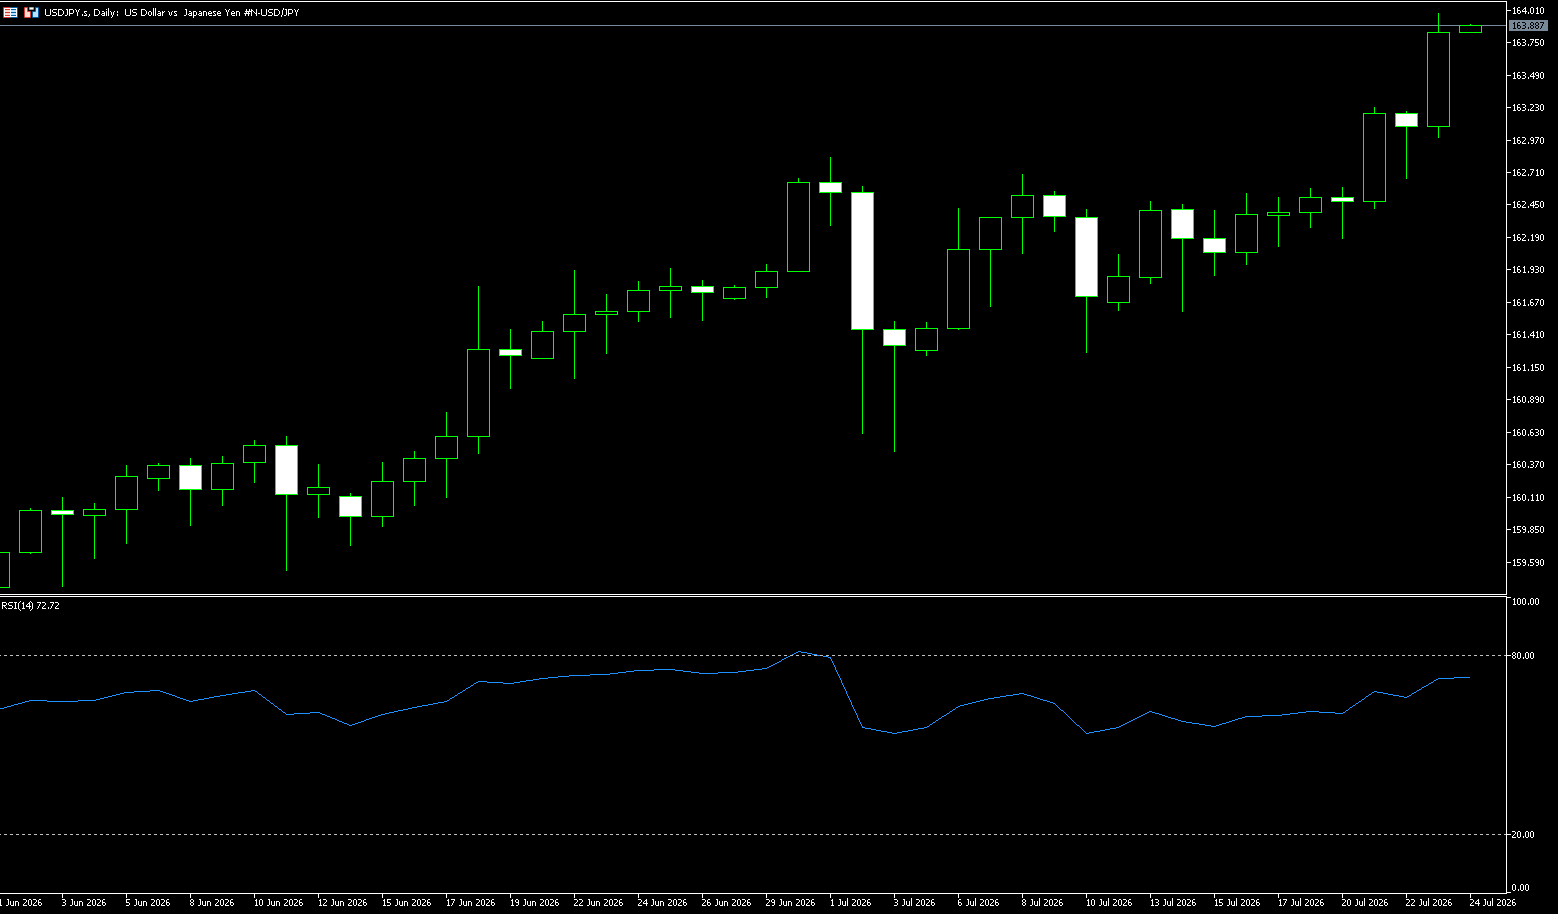
On Thursday, USD/JPY traded above 163.90 as the dollar strengthened following significantly better-than-expected US labor market data. Initial jobless claims in the US fell to 187,000 for the week ending July 18, well below market expectations of 212,000 and the revised previous week's figure of 209,000. This result marks the lowest level since 1969, indicating that despite signs of a slowdown in hiring, layoffs remain extremely limited. Japanese Finance Minister Satsuki Katayama reiterated that the government is prepared to take decisive action on the foreign exchange market if necessary. In addition, the Bank of Japan's hawkish expectations provided some support for the yen, which, along with the slight weakening of the dollar, weighed on the USD/JPY pair. However, due to the significant contrast between Japan's monetary policy and that of the rest of the world, the downside potential remains somewhat buffered. Despite the Bank of Japan's recent interest rate hike to 1%, the highest level since 1995, and reports that officials are willing to raise rates at a faster pace, Japan's borrowing costs remain exceptionally low compared to other major economies, including the United States. This has kept so-called carry trades active, a key factor in the yen's underperformance. Furthermore, economic risks stemming from energy supply disruptions caused by the Middle East conflict have also weighed on the yen.
The USD/JPY pair is trading at 163.80, holding a bullish bias and consolidating near a multi-decade high of 162.84. The pair is trading near the 5-day exponential moving average at 163.08, reflecting a consolidation pattern. The Relative Strength Index (RSI) of 69 indicates robust but not excessive buying pressure. Spot prices remain near the 40-year high reached on Tuesday and are currently trading slightly below the 164.00 level. On the upside, the multi-decade high of 164 acts as immediate resistance; a break above this level would allow the pair to potentially test 164.00 further. On the downside, the multi-year high of 163.24 is the immediate support level; a sustained break below this area would expose a deeper risk of retracement, targeting the 5-day exponential moving average at 163.08.
Consider shorting the US dollar today at 164.00, with a stop loss at 164.20 and targets at 163.24 and 163.10.
EUR/USD
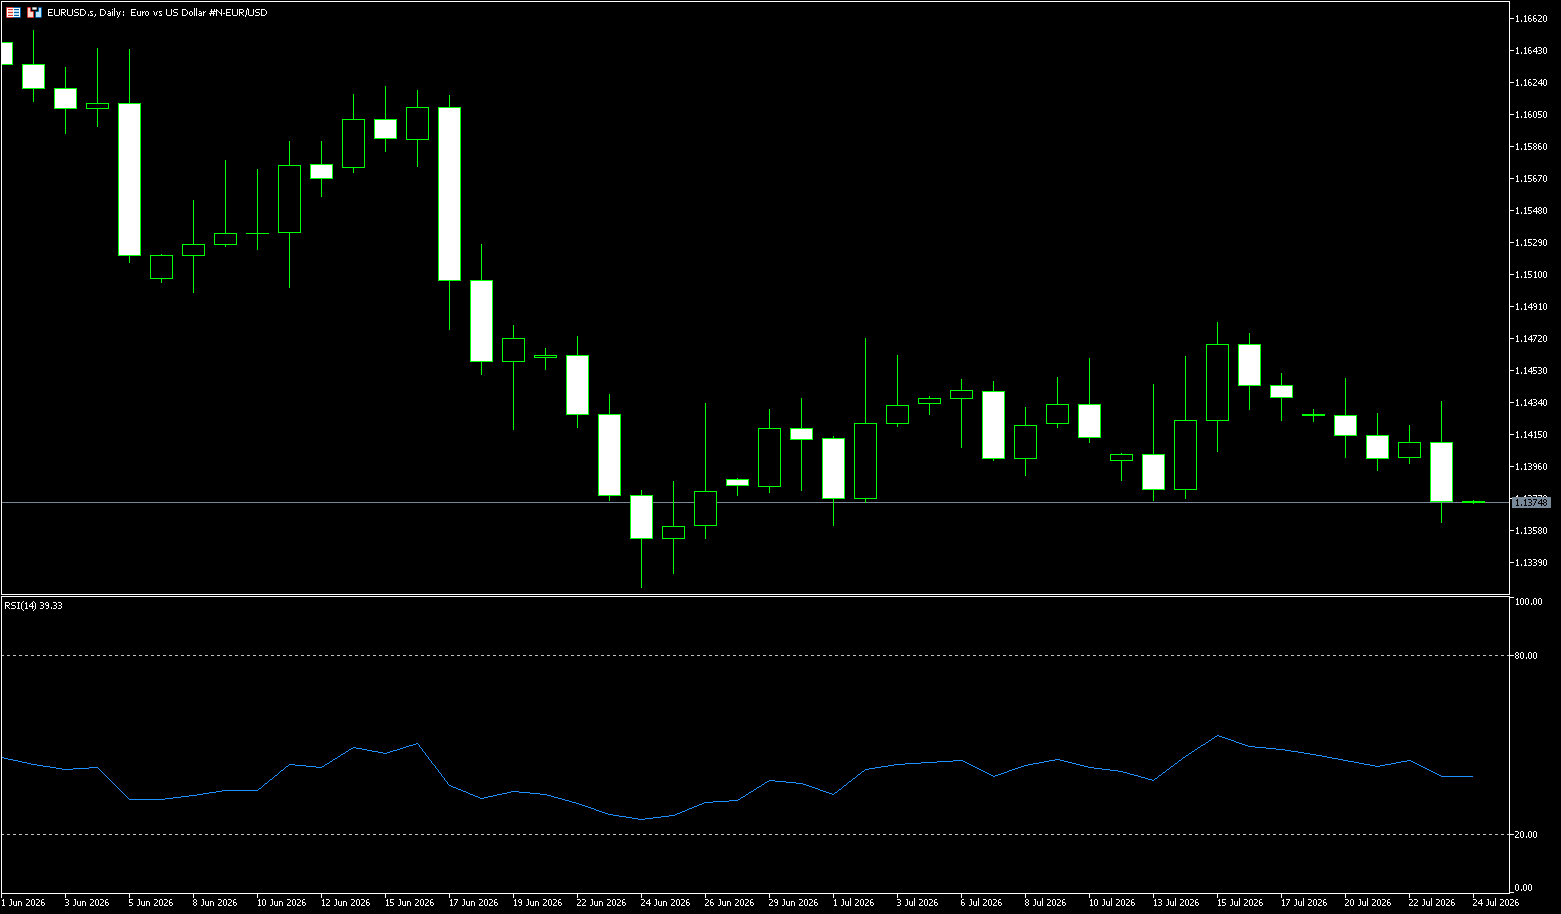
The EUR/USD pair continued to face heavy selling pressure in the second half of Thursday, trading below its three-week low of 1.1360. The ECB's cautious stance on recent policy tightening, coupled with risk aversion driving a broad-based strengthening of the US dollar, dragged the pair lower. Therefore, investors will be closely watching the monetary policy statement and ECB President Christine Lagarde's press conference for insights into monetary policy and the inflation outlook. ECB policymaker and Bank of Italy Governor Fabio Panetta stated in mid-month that the central bank's goal is to firmly anchor inflation expectations and limit the indirect and secondary effects of shocks. Meanwhile, despite oil prices surging due to Middle East energy supply risks, the US dollar faced slight selling pressure. Continued concerns that escalating tensions in the Middle East could disrupt global oil supplies have exacerbated expectations that inflationary pressures in the Eurozone may remain high.
The euro/dollar pair is trading around 1.1375, indicating a neutral short-term bias. The pair is in a bearish flag pattern, a continuation pattern that signals a continuation of the downtrend after a brief consolidation. The 14-day Relative Strength Index (RSI) remains within the 40.00-50.00 range, suggesting moderate bullish momentum and reinforcing the view that any rebound is likely to be capped as long as prices remain below nearby moving averages and trendline resistance levels. On the upside, the psychological level of 1.1500 is immediate resistance, with a more significant resistance level at 1.1521 near the upper trendline of the ascending channel. On the downside, initial support is seen at the June 24 low of 1.1324; a clear break below this level would open the way for further declines towards 1.3300.
Today, consider going long on the Euro at 1.1365, with a stop-loss at 1.1355 and targets at 1.1410 and 1.1420.
Stock Analysis:
Australian ASX 200 Stock Index
Basic Market Overview:
The Australian ASX 200 index rose 16 points, or 0.2%, to close at 8,839 on Thursday, marking its third consecutive day of gains, driven by strong performance in non-energy mining, utilities, and technology stocks. However, the market retreated somewhat after the early gains, as strong June employment data increased expectations of another interest rate hike by the Reserve Bank of Australia. The central bank has raised the cash rate three times this year to 4.35% to curb inflation, completely reversing its policy easing stance set for 2025. Meanwhile, the unemployment rate remained at 4.4%, in line with market expectations. Traders are also cautiously awaiting the release of the preliminary July Purchasing Managers' Index (PMI) data scheduled for Friday.
Woodside Energy rose 0.5% due to escalating tensions in the Middle East, while Santos gained 0.3% despite missing second-quarter sales expectations. Rising gold prices supported mining companies, pushing Northern Star Resources up 2.6% and Evolution Mining up 2.1%. Meanwhile, the four major banks saw gains between 0.5% and 1.3%. Conversely, Macquarie fell 0.6% after announcing the retirement of its long-time CEO.
Sector Performance:
The broader market closed down approximately 0.1% to 0.3% for the week, marking its second consecutive week of weakness. Defensive and oil & gas sectors performed strongly across the board, while resource mining and technology sectors significantly dragged down the index.
This Week's Top Performing Sectors (from Strongest to Weakest)
Top Performing Sectors (from Strongest to Weakest)
1. Materials +1.37% (Strongest Performer) Gold and base metals strengthened, with gold mining stocks leading the gains; Representatives: Northern Star Resources, Evolution Mining
2. Energy +0.98% Middle East geopolitical risks supported oil prices; Woodside Energy and Santos saw slight increases.
3. Utilities +0.65% Defensive sectors received capital allocation.
Lagging Sectors (from Weakest to Strongest)
1. Information Technology (IT) -3.32% (Largest Decline) Rising interest rate expectations weighed on growth stocks; WiseTech and Xero weakened significantly.
2. Consumer Discretionary -1.52%
3. Healthcare -1.43%
Technical Analysis:
The ASX200 closed at 8839 points on Thursday, a slight increase of 0.2%; it rose sharply in early trading on Thursday, reaching a high of 8888. First-tier market: Australian June employment data significantly exceeded expectations (76,000 new jobs, compared to an expected 15,000), causing the market to re-price the probability of an RBA rate hike in August. The Australian dollar and Australian government bond yields rose rapidly, and the index rose and then fell back during the day, narrowing its gains at the close, forming a small positive candlestick with a long upper shadow. Sector divergence was evident: gold mining and energy sectors were strong; real estate, technology, and some financial stocks were under pressure, resulting in weak market breadth, with fewer rising stocks than falling stocks, indicating a resource-driven index rally. Pattern definition: A slightly bullish oscillation, but the upward pace has slowed, showing signs of pressure; range-bound trading is predominant, and chasing highs should be approached with caution. The RSI indicator remains around 55, not yet overbought, indicating some bullish momentum, but the pullback suggests increased selling pressure above. The index has stabilized above short-term moving averages, but the long upper shadow warns of significant upward pressure, reducing the cost-effectiveness of one-sided long positions, and entering a range-bound trading pattern. The ASX200 is currently in a slightly bullish oscillation phase, encountering resistance on the upside. Short-term trading is suitable within a range, buying low and selling high. Only by effectively holding above 8900 can the bulls regain control. Once the 8740 support level is breached, this rebound will end, and the market will turn downwards to test lower support levels.
Trading Strategies:
The following are technical trading ideas only and do not constitute investment advice. Leveraged trading may result in losses exceeding the principal.
Bull Strategy (Trend-Following Rebound):
• Entry Conditions: Buy on dips after finding support at 8780-8800 and stabilizing on intraday charts.
• Stop Loss: Exit if the price breaks below 8760.
• Target 1: 8870; Target 2: 8900
• Note: Do not chase the price higher near the 8890-8900 resistance zone; take profits in stages.
Bear Strategy (Trading on Pullbacks):
• Entry Conditions: Short if the price rebounds to the 8870-8900 resistance zone and encounters resistance, showing signs of a pullback.
• Stop Loss: Breakout above 8925.
• Target 1: 8800; Target 2: 8740
Key Risk Warnings:
RBA Rate Hike Expectations Disrupt Trading
Strong Employment Data Pushes Up 8 Monthly interest rate hike expectations. If subsequent inflation data rebounds again, continued interest rate hike expectations will suppress the banking and real estate sectors, creating medium-term pressure on the ASX200; fluctuations in US Treasury yields will also transmit to risk asset valuations.
Commodity and Chinese Demand Risks
The index weighting is concentrated in the mining sector (BHP, Rio Tinto), and iron ore, copper, and gold prices directly affect the index; changes in Chinese real estate and industrial data will quickly drive fluctuations in resource stocks.
Australian Dollar Exchange Rate Hedging Effect
A stronger Australian dollar is unfavorable to export-oriented mining companies; significant fluctuations in the ASX-US exchange rate will amplify the volatility of the ASX200.
External Market Linkage Risks
Overnight volatility in US stocks and geopolitical conflicts (Middle East situation disrupting oil prices and risk appetite) will directly affect the opening gap of the ASX the following day, easily triggering stop-loss orders.
New Zealand 50 Index (NZX50)
Basic Market Overview:
The New Zealand stock market rose 32 points, or 0.2%, to close at 13,795 on Thursday, reversing earlier weakness to mark its second consecutive day of gains and a record high, boosted by energy, materials, and consumer goods stocks. The energy sector rose 4.6%, with Channel Infrastructure NZ, a world-class operator of energy infrastructure for New Zealand and Australia, gaining 4.6% on optimism surrounding its fuel storage projects. However, gains were limited by a decline in US futures, influenced by weak trading on Wall Street overnight, at the start of the earnings season for major technology companies. Persistently high oil prices also weighed on market sentiment, with inflation concerns fueling expectations of further interest rate hikes. Data released on Tuesday showed that New Zealand's inflation rate accelerated to its highest level since the fourth quarter of 2023 in the second quarter.
Other standout performers include Freightways Group (3.2%), Hallenstein Glasson (2.8%), Westpac Banking Corp (2.0%), ANZ Group (1.9%), and Meridian Energy (1.8%).
Sector Performance:
Leading Sectors
4. All Energy: +4.6% [Strongest Performer]
Core Driver: Rising oil prices, market optimism regarding energy storage projects
Leading Stocks: Channel Infrastructure NZ (+4.6%), Meridian Energy (+1.8%)
5. Materials: Slightly Stronger
6. Consumer Discretionary: Fluctuating Upwards
Representative Stocks: Freightways Group (+3.2%), Hallenstein Glasson (+2.8%)
7. Financials: Moderately Higher
Westpac (+2.0%), ANZ (+1.9%)
Leading Sectors/Under Pressure
8. Healthcare: Continued Pressure Throughout the Day
Fisher & Paykel Healthcare weakened in the morning, weighing on the sector's overall performance.
9. Utilities: Slightly Lower
10. Consumer Staples Weak Performance
Technical Analysis:
The New Zealand stock market opened at 13,711, a slight pullback from its short-term high, and is generally in a high-level range-bound trading pattern. The NZX50 recently tested the year's high range of 13750-13830 but encountered resistance; after rebounding the previous day, it fell back in early Thursday trading, indicating high-level consolidation without a clear breakout. The index has stabilized above the 50-day moving average, and the medium-term trend remains bullish; however, the 5-day moving average has turned into short-term resistance, and upward momentum has slowed. Technically, it is in a high-level consolidation range, with resistance above and solid support below, lacking a clear unidirectional trend and primarily exhibiting range-bound fluctuations. Technical Indicators:
RSI: Pulled back from its high, entering a neutral range, with no obvious overbought/oversold conditions, showing clear oscillating characteristics; MACD: The red bars are continuously narrowing, indicating weakening bullish momentum, and caution is advised regarding repeated high-level consolidation.
Trading Strategy:
This information is for market analysis and reference only and does not constitute any trading or investment advice.
Bullish Strategy (Buy on Dips)
• Entry Range: 13650–13670
• Stop Loss: Exit if 13620 is broken.
• Target: First target 13740; break above to 13820.
• Applicable Conditions: No new lows are made on pullbacks to support levels, and buying support is evident.
Bearish Strategy (Short Sell on Pressure, Short-Term Trading)
• Entry Range: 13740–13760; Failure to break above resistance.
• Stop Loss: Exit if 13790 is broken.
• Target: 13660 → 13590
• Note: This is for short-term trading only. The medium-term trend for NZX remains bullish; short positions should not be held long-term.
Risk Warning:
Macroeconomic Policy Risk (Largest Local Risk)
New Zealand inflation data exceeding expectations; if the Reserve Bank releases hawkish comments on interest rate hikes, it will directly suppress local equity assets, triggering a rapid decline in the index.
External Linkage Risks:
The NZX index closely follows US stock market risk appetite; fluctuations in US economic data and tech earnings reports tonight will directly impact the opening gap of the New Zealand market the following day.
Technical Breakdown Risks:
A decisive break below 13580: The consolidation pattern is broken, initiating a deeper correction;
A sustained hold above 13830: Opens up new upward potential, rendering all bearish strategies ineffective.
Liquidity Risks: Overall trading activity in the New Zealand stock market is weaker than in Hong Kong and US markets. Extreme market conditions can easily lead to slippage. It is not recommended to set excessively wide/extreme price limits for orders, and leverage should be strictly controlled.
Disclaimer: The information contained herein (1) is proprietary to BCR and/or its content providers; (2) may not be copied or distributed; (3) is not warranted to be accurate, complete or timely; and, (4) does not constitute advice or a recommendation by BCR or its content providers in respect of the investment in financial instruments. Neither BCR or its content providers are responsible for any damages or losses arising from any use of this information. Past performance is no guarantee of future results.
Lebih Liputan





Pendedahan Risiko:Instrumen derivatif diniagakan di luar bursa dengan margin, yang bermakna ia membawa tahap risiko yang tinggi dan terdapat kemungkinan anda boleh kehilangan seluruh pelaburan anda. Produk-produk ini tidak sesuai untuk semua pelabur. Pastikan anda memahami sepenuhnya risiko dan pertimbangkan dengan teliti keadaan kewangan dan pengalaman dagangan anda sebelum berdagang. Cari nasihat kewangan bebas jika perlu sebelum membuka akaun dengan BCR.
BCR Co Pty Ltd (No. Syarikat 1975046) ialah syarikat yang diperbadankan di bawah undang-undang British Virgin Islands, dengan pejabat berdaftar di Trident Chambers, Wickham’s Cay 1, Road Town, Tortola, British Virgin Islands, dan dilesenkan serta dikawal selia oleh Suruhanjaya Perkhidmatan Kewangan British Virgin Islands di bawah Lesen No. SIBA/L/19/1122.
Open Bridge Limited (No. Syarikat 16701394) ialah syarikat yang diperbadankan di bawah Akta Syarikat 2006 dan berdaftar di England dan Wales, dengan alamat berdaftar di Kemp House, 160 City Road, London, England, EC1V 2NX. Open Bridge Limited bertindak semata-mata sebagai pemproses pembayaran untuk BCR Co Pty Ltd dan tidak menyediakan sebarang perkhidmatan kewangan, perdagangan atau pelaburan bagi pihaknya. Peranan Open Bridge Limited adalah terhad kepada pemprosesan pembayaran.


 English
 简体中文
简体中文
 繁體中文
繁體中文
 Bahasa
Melayu
Bahasa
Melayu
 Tiếng
Việt
Tiếng
Việt
 ไทย
ไทย
 日本語
日本語
 한국어
한국어
 ភាសាខ្មែរ
 español