


0
US Dollar Index
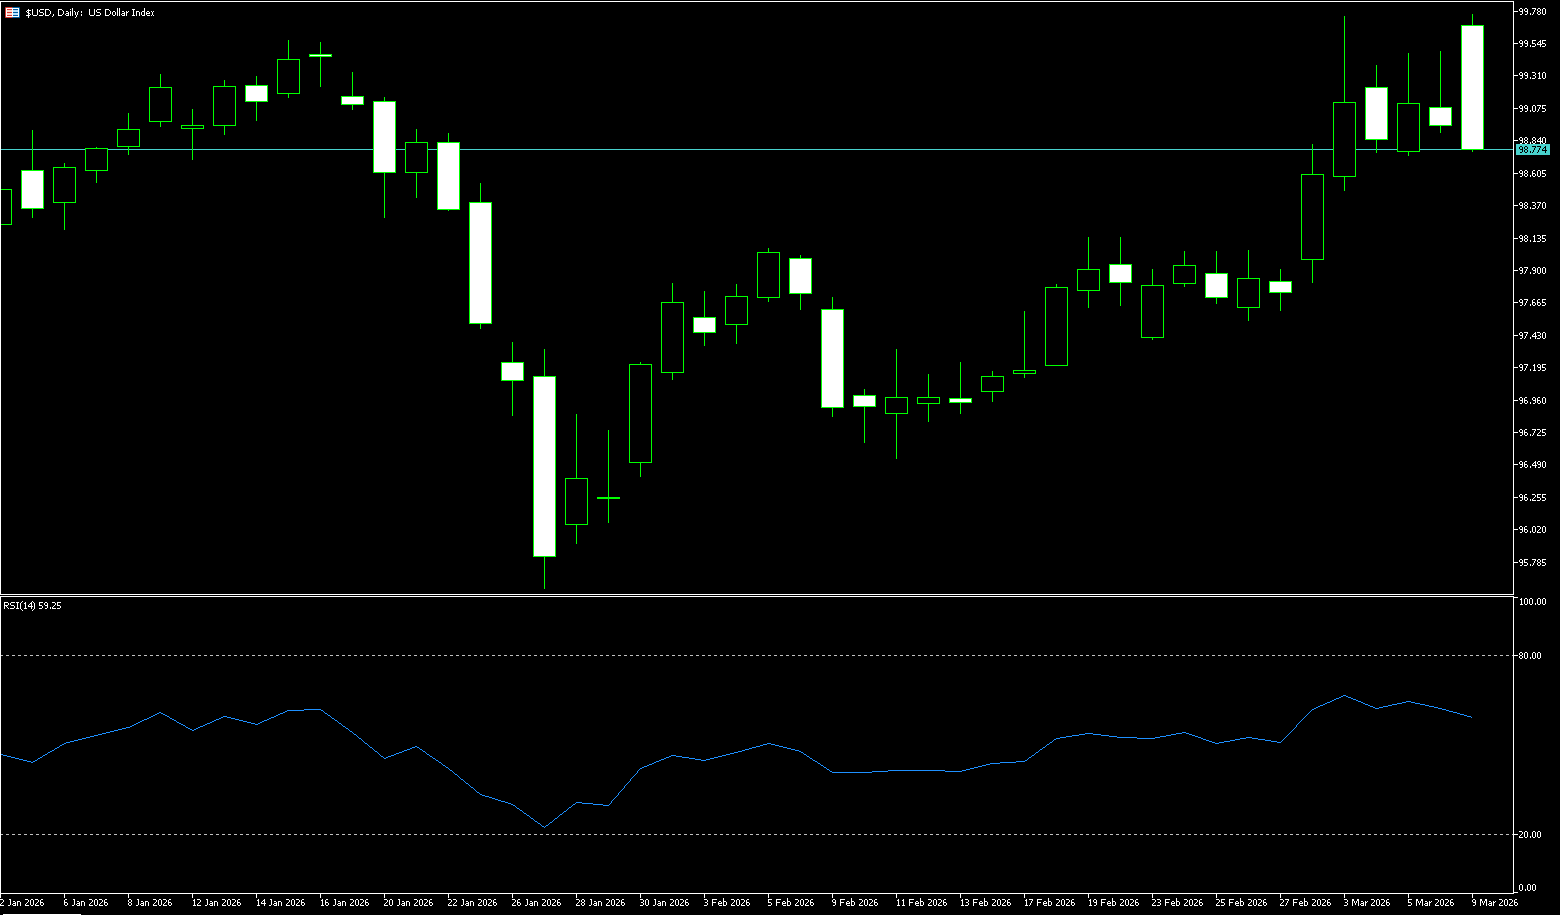
Last week, the US dollar experienced a rollercoaster ride. In the first half of the week, supported by safe-haven demand triggered by escalating Middle East conflicts and high oil prices, the dollar continued its previous strength. However, Friday's release of the US February non-farm payrolls report became a turning point. The unexpected contraction in employment data significantly altered market expectations for the Federal Reserve's policy. After the data release, the US interest rate futures market predicted a 76% probability of the Fed restarting rate cuts in September. This rapid rise in rate cut expectations pressured the dollar on Friday. However, the dollar index still closed the week up over 1.0%, marking its largest weekly gain since mid-November 2024, but the weekly chart showed a long upper shadow, indicating a strong pullback after the initial surge. Fundamentally, there were few changes; Friday's gains in other currencies against the dollar were likely driven by technical factors. The euro and Canadian dollar both attempted to break their weekly lows but failed, providing an opportunity for short covering and a rebound in non-US currencies. For bears to maintain control, a break above the current lows is necessary.
On the daily chart, the US Dollar Index is trading around 99.35. The short-term bias is bullish, as the index remains above the 55-day and 100-day simple moving averages near 98.00 and 98.56, respectively, while the 200-day moving average is stabilizing around 98.34, further solidifying initial support. The Relative Strength Index (RSI) is at 69, indicating positive momentum and no overbought conditions, while the gradually rising Average Directional Index (ADX) has returned to the 20-second range, suggesting a rebuilding of trend strength after the previous consolidation phase. Immediate resistance is seen at 99.68 (the previous high); a daily close above this level would open the path to the psychological level of 100. On the downside, initial support is expected at 99.10 near the 5-day simple moving average, followed by the psychological level of 99.00. As long as the index holds above 99.00-99.10, pullbacks are more likely to be absorbed within the developing bullish continuation phase.
Today, consider shorting the US Dollar Index around 98.85; Stop loss: 98.96, Target: 98.40; 98.30
WTI Crude Oil
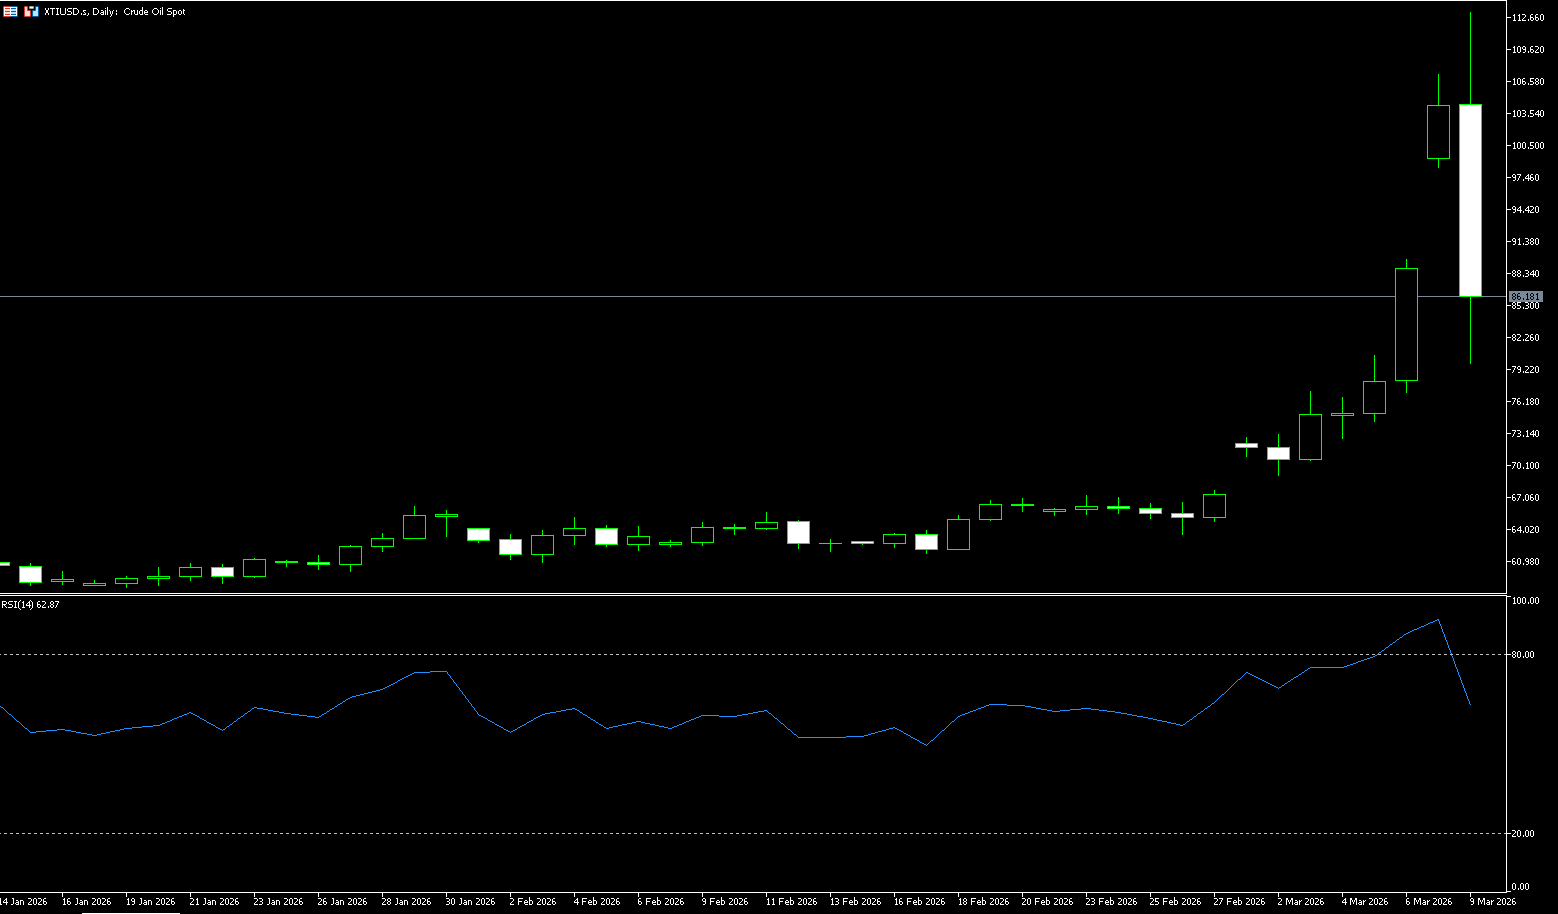
US crude oil opened higher on Monday, rising over 20%, briefly surpassing $100 per barrel, reaching a high of $113.28 per barrel, the highest level since July 2022. This was driven by the escalating conflict with Iran, with oil production in Iraq and Kuwait beginning to halt. Both the US and Iran took a hard line over the weekend, while the Israeli military stated it would target Khamenei's successor. As the world's most important oil shipping chokepoint, the Strait of Hormuz handles approximately 20% of global oil demand daily. Since the US and Israel attacked Iran, the waterway has been effectively closed for seven days, preventing approximately 140 million barrels of crude oil from entering the market, triggering a scramble for available oil. UBS analysts pointed out that the US, as the largest producer, is experiencing a rapid decline in inventories due to surging exports, causing US crude oil to outperform Brent crude for two consecutive days. Qatar's energy minister warned that all Gulf energy producers are expected to halt exports within weeks, potentially pushing oil prices up to $150 per barrel. Market analysts generally believe that predictions of oil prices breaking through $100 per barrel are imminent. Meanwhile, US President Trump stated in an interview that he is not worried about the resulting increase in US gasoline prices.
From a technical perspective, both major benchmark crude oils were in extremely overbought territory before last week's close. The MACD lines turned upwards for the second time above the zero line, but the expansion of the red bars weakened, suggesting an accumulating risk of bearish divergence. US crude oil opened higher on Monday, rising over 20% and surpassing $100 per barrel, reaching a high of around $113.28 per barrel, its highest level since July 2022. Whether market panic can ease depends entirely on the course of the Middle East conflict. Although there is a strong technical need for a pullback, given the substantial supply disruptions, any pullback could become an opportunity for bulls to reposition. WTI crude oil prices are showing greater strength, with no clear signs of weakening bullish momentum. However, the candlestick pattern of a large bullish candle with a long upper shadow indicates strong resistance in the $110.00 (psychological level) - $110.80 (2022 high) range, suggesting a short-term pullback is likely. Support levels are at $80.00 (psychological level) and $74.22 (9-day moving average).
Today, consider going long on crude oil around 83.15; stop loss: 83.00, target: 88.00; 89.00
Spot Gold
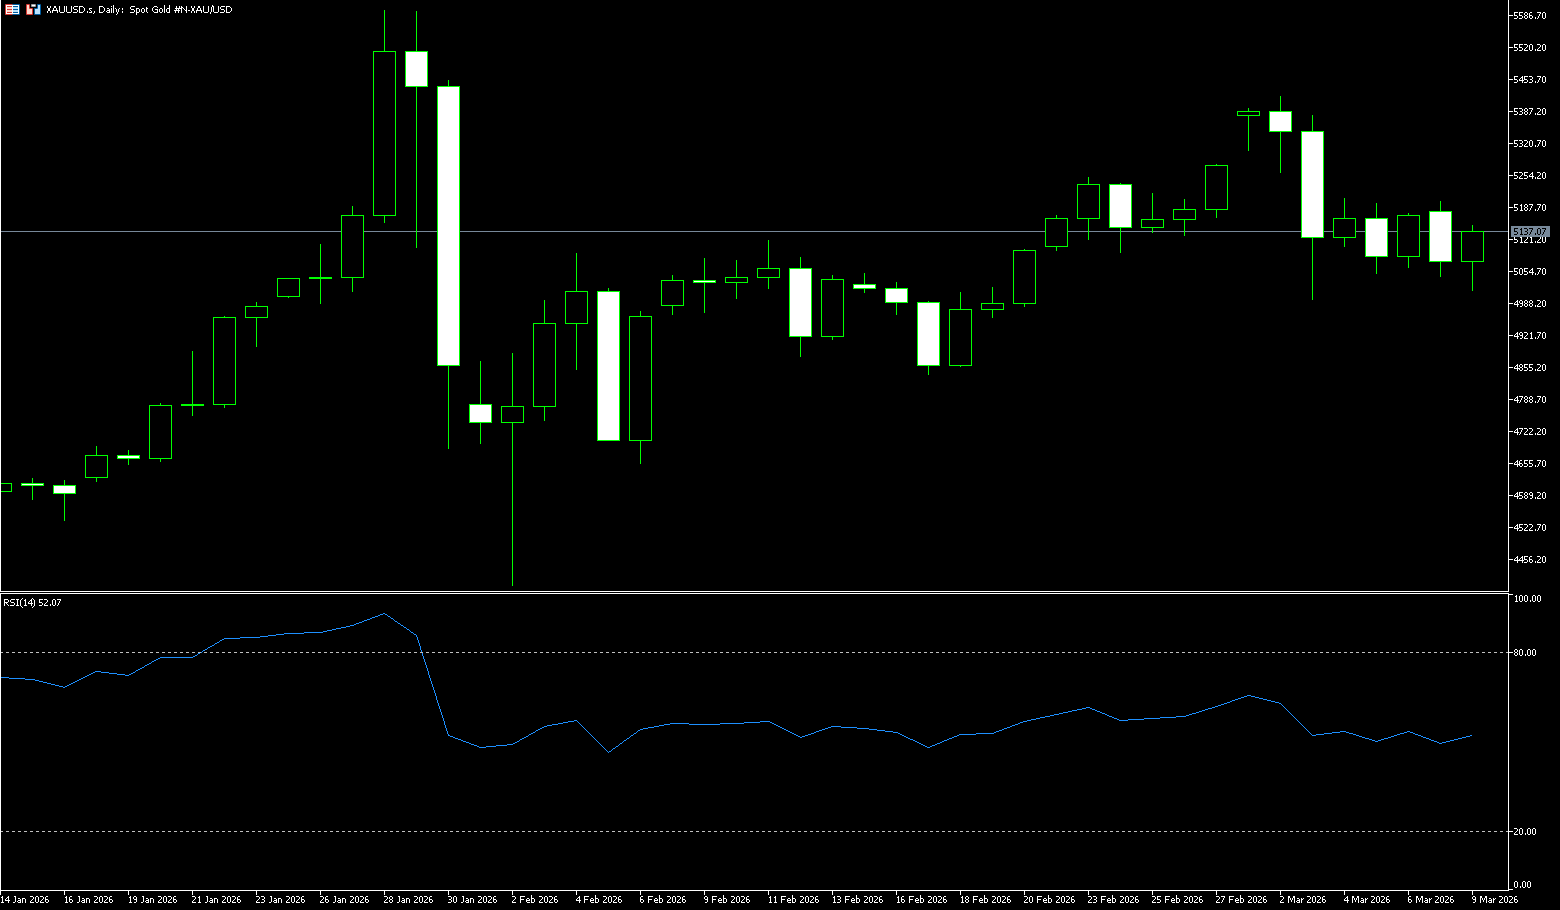
In early Asian trading on March 9th (Beijing time), spot gold traded near a low of $5,014.90 per ounce, a drop of over 2.0%. Weaker-than-expected US employment data maintained market hopes for a Fed rate cut, but recent gold price movements have been suppressed by a stronger dollar. Although escalating geopolitical conflicts in the Middle East (Israel's fierce airstrikes on Beirut) typically boost safe-haven demand, the dollar index recorded its strongest weekly gain in over a year last week. A strong dollar makes dollar-denominated gold more expensive for overseas buyers, limiting the upside potential for gold prices. Gold does face short-term pressure. The dollar index opened higher on Monday and rose more than 0.6%, coupled with inflation concerns stemming from continued oil price increases, directly causing gold prices to give back Friday's gains significantly on Monday. However, the long-term bullish logic for gold remains unshaken. While the "war premium" from the Iranian conflict may subside in the short term, gold's role as the ultimate store of value will once again become prominent should the conflict become protracted or escalate.
In summary, last week's "one-day rise, one-week fall" pattern for gold accurately reflects the current complex macroeconomic and geopolitical environment: weak US employment data boosted expectations of interest rate cuts, but this was completely offset by oil price inflation triggered by the Middle East conflict and the safe-haven demand for the US dollar; although gold is under temporary pressure, the $5,000 support level has not been broken, and the long-term upward logic—inflation hedging, a low-interest-rate environment, and global uncertainty—remains unchanged. Entering this week, the market will re-evaluate the risks of stagflation and the timing of interest rate cuts. If oil prices can stabilize in the $100-$110 range and the US dollar stops its one-sided strengthening, gold is likely to resume its upward trend, and may even challenge the $5,200-$5,300 area. Technically, although spot gold was dragged down by the US dollar and oil prices, the levels of 4,842 (the low of February 17th) and 4,842 (the 55-day moving average) still provide good support, and the correction is considered a healthy pullback. Initial support is at $5,000 (a psychological level), and before correcting to $4,840-$4,842, the $4,900 level should be watched. On the other hand, if gold recovers and rebounds, it will target the $5,200 (a psychological level) and the $5,162 (9-day moving average) area. A break above this level would target $5,265 (the high of February 27th).
Consider going long on gold today around 5,133; Stop loss: 5.128; Target: 5,190; 5,200
AUD/USD
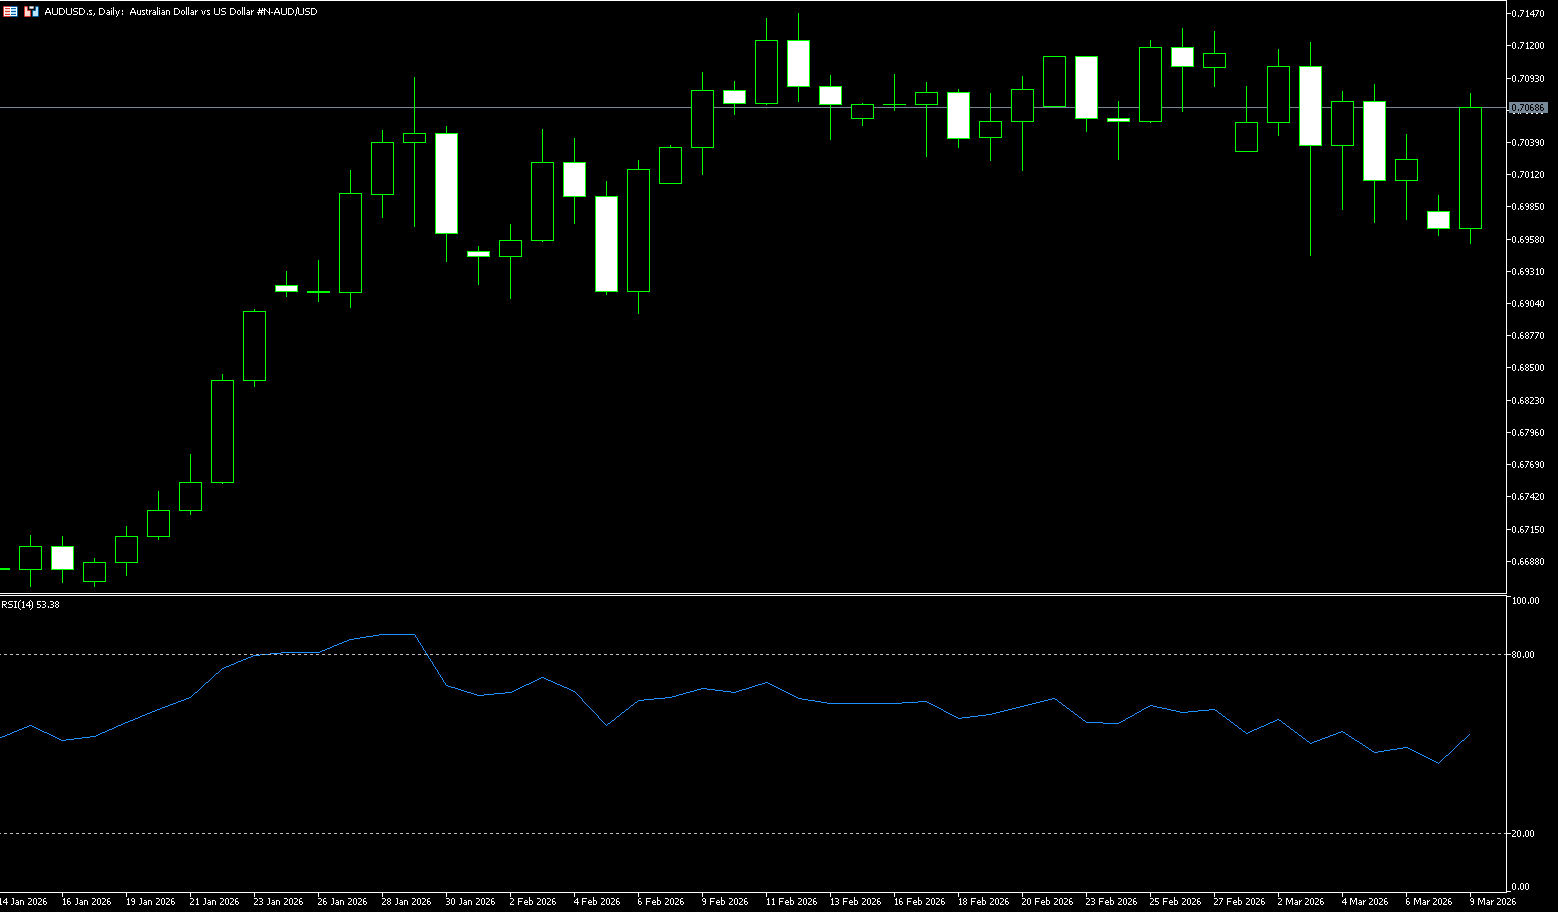
The AUD/USD pair started the week weakly in Asian trading on Monday, trading slightly above 0.7060. The Australian dollar weakened due to escalating tensions in the Middle East, as the US dollar strengthened on safe-haven demand. Later, the market will focus on China's February Consumer Price Index (CPI) data, which could impact the Australian dollar given Australia's close trade ties with China. The US dollar also received support as WTI crude oil prices surged above US$100.00 per barrel, amid market concerns that the ongoing Middle East conflict could disrupt global energy supplies for an extended period. Furthermore, the US dollar received additional support as traders revised their inflation expectations following last week's hostilities, reinforcing market bets that the Federal Reserve might postpone interest rate cuts. Meanwhile, discussions about a potential rate hike by the Reserve Bank of Australia continue, with the market assessing the impact of rising energy costs and global uncertainty on inflation and economic growth.
The Australian dollar/US dollar pair remains within the familiar 0.6950–0.7100 range, without a clear breakout. The Australian dollar continues to be supported by stubborn domestic inflation and the Reserve Bank of Australia's reluctance to soften its hawkish stance. On the upside, watch 0.7147 (February 12 high) and 0.7100 (psychological level), which structurally maintains a broader bullish narrative. However, the beginning of the week brought a test of reality. AUD/USD gave back some of its recent gains, briefly falling to the bottom of its range around 0.6956, below 0.7000, as sentiment turned pessimistic. The trigger was not domestic factors, but geopolitics. The weekend attacks by the US and Israel on Iran reignited the already fragile situation in the Middle East. The market reacted in a classic way: risk aversion, dollar buying, and a surge in oil prices. In this environment, high-beta currencies like the Australian dollar tend to retreat.
Consider going long on AUD/USD around 0.7063 today; Stop loss: 0.7050; Target: 0.7120; 0.7130
GBP/USD
On Monday, the GBP/USD pair attracted some buying interest around 1.3440. Escalating hostilities in the Middle East have boosted safe-haven currencies such as the US dollar against the British pound. Traders will be watching for further clues from the US February Consumer Price Index (CPI) inflation report later on Wednesday. Signs of a protracted war in the Middle East continue to support the dollar and act as resistance for the pair in the short term. In the current environment, the dollar is the biggest beneficiary due to its safe-haven status and the US's position as a net energy exporter. How high the dollar can rise from here depends on the depth and duration of the conflict, which remains highly uncertain. On the other hand, a disappointing US jobs report could limit the downside for GBP/USD.
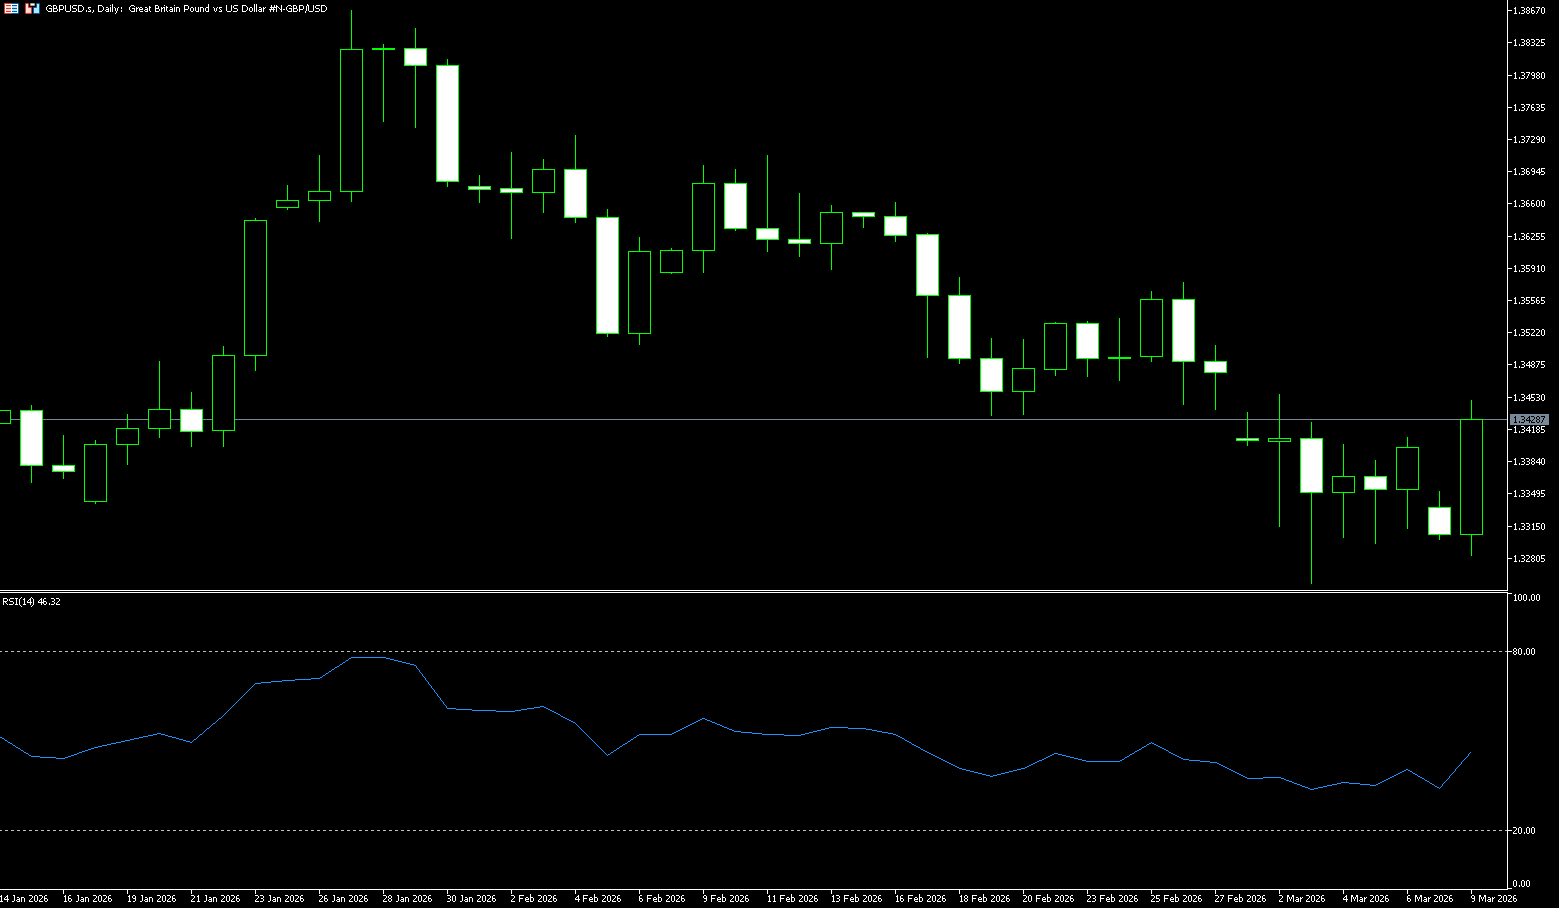
The pound's movements are closely linked to the strength of the US dollar and the UK's own economic outlook. In the first half of last week, the pound remained under pressure from both a strong dollar and Middle East tensions. Although it rebounded slightly on Friday due to a decline in the dollar index, concerns about the risk of stagflation in the UK economy have not dissipated. Rising energy costs due to geopolitical tensions have added further uncertainty to already strained UK consumer spending and business activity, making investors cautious about any potential pound rebound. Technical analysis shows that the overall trend this week has been one of low-level consolidation after a downtrend, having fallen from 1.3869 (January 27th high) to a low of 1.3253. Technical indicators show that the MACD has formed a golden cross below the zero line, with a slight increase in the red momentum bars, indicating a potential short-term oversold rebound. However, significant resistance is also present, with 1.3575 (February 26th high) and 1.3500 (psychological level) forming a strong resistance zone, limiting the upside potential. On the downside, watch the 1.3300 (psychological level) and the 1.3385 (5-day moving average) area.
Today, consider going long on GBP/USD around 1.3430; Stop loss: 1.3420, Target: 1.3480; 1.3490
USD/JPY
Last week, USD/JPY continued its winning streak during Monday's Asian session, trading around 157.80. The currency pair rose due to safe-haven demand driving up the US dollar. The war with Iran has entered its second week with no clear solution yet. Last week, US President Trump stated that the appointment would be "unacceptable" and hinted that Washington should play a role in choosing Iran's next Supreme Leader. The dollar also received support as WTI oil prices surged above $100.00 per barrel. Furthermore, the dollar gained additional support as traders revised their inflation expectations following last week's hostilities, further reinforcing bets that the Federal Reserve might postpone interest rate cuts. Japan's labor cash income in January 2026 increased by 3% year-on-year, following a 2.5% increase in December 2025.
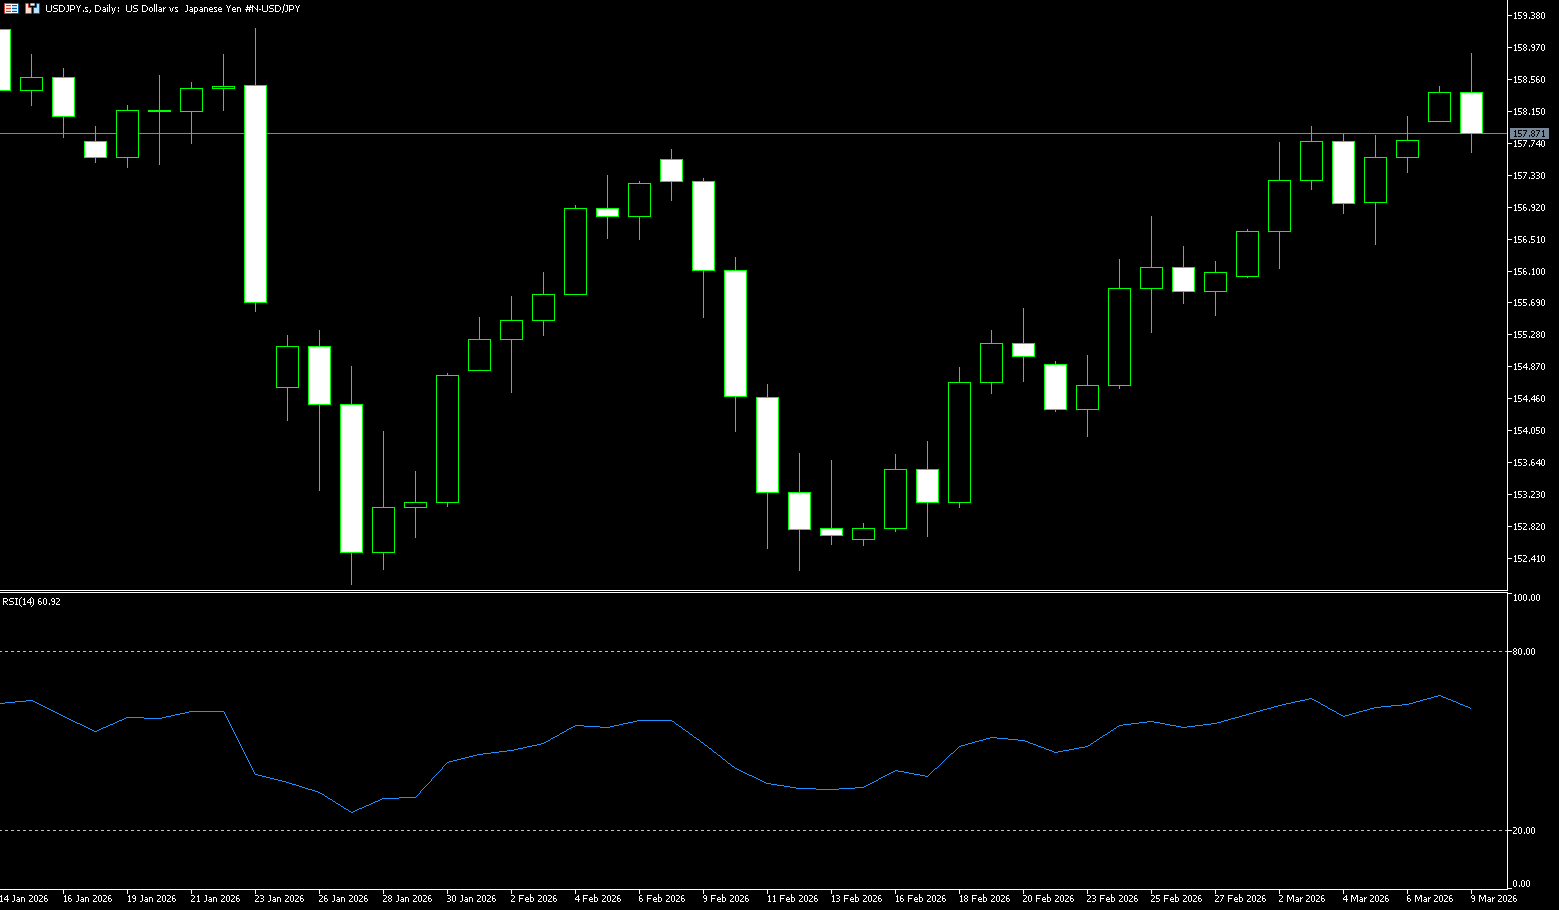
Last week, the USD/JPY pair was the only major currency pair to maintain a clear bullish trend, rising 1.00% for the week. While the escalating conflict in the Middle East strengthened the traditional safe-haven currency, the Swiss franc, the yen did not show significant safe-haven buying, instead weakening against the dollar. This reflects the continued dominance of the large interest rate differential between the US and Japan. Before any extreme panic in the market triggers a large-scale risk liquidation, interest rate differentials have had a greater impact on the USD/JPY exchange rate than traditional safe-haven logic, further driving the USD/JPY higher. Technically, the pair has risen steadily from its February 12 low of 152.27, reaching a near 8-week high of 158.74. All moving averages are in a bullish alignment, the Bollinger Bands continue to widen upwards, and the MACD indicator is flat at a high level, indicating strong upward momentum. Market focus is on whether it can break through the previous high of 158.084 to open up further upside potential. Support levels are seen at the Bollinger Band middle line at 157.40 and the 157.00 level. On the upside, watch the 159.45 (January 12 high) and the 160.00 (psychological level) area.
Today, consider shorting the US dollar around 157.86; Stop loss: 158.00; Target: 157.00; 156.80
EUR/USD
The EUR/USD pair opened with a bearish gap at the start of the new week and fell to a new low since November 2025 during the Asian session, around the 1.1500-1.1510 range. Furthermore, the fundamental background suggests that the lowest resistance path for spot prices remains downward. With investors ignoring Friday's disappointing US non-farm payroll report, the escalation of conflict in the Middle East reignited demand for the safe-haven dollar, considered a key factor putting pressure on the EUR/USD pair. Meanwhile, oil prices surged to the psychological level of $100 due to concerns about supply disruptions in the Strait of Hormuz, exacerbating inflation concerns. This, in turn, forced investors to postpone their expectations for the timing of the next Fed rate hike and continued to push up US Treasury yields, thus supporting the dollar. Given Europe's dependence on imported energy, further increases in oil and gas prices could trigger a significant economic shock. This confirmed the negative outlook for the EUR/USD currency pair.
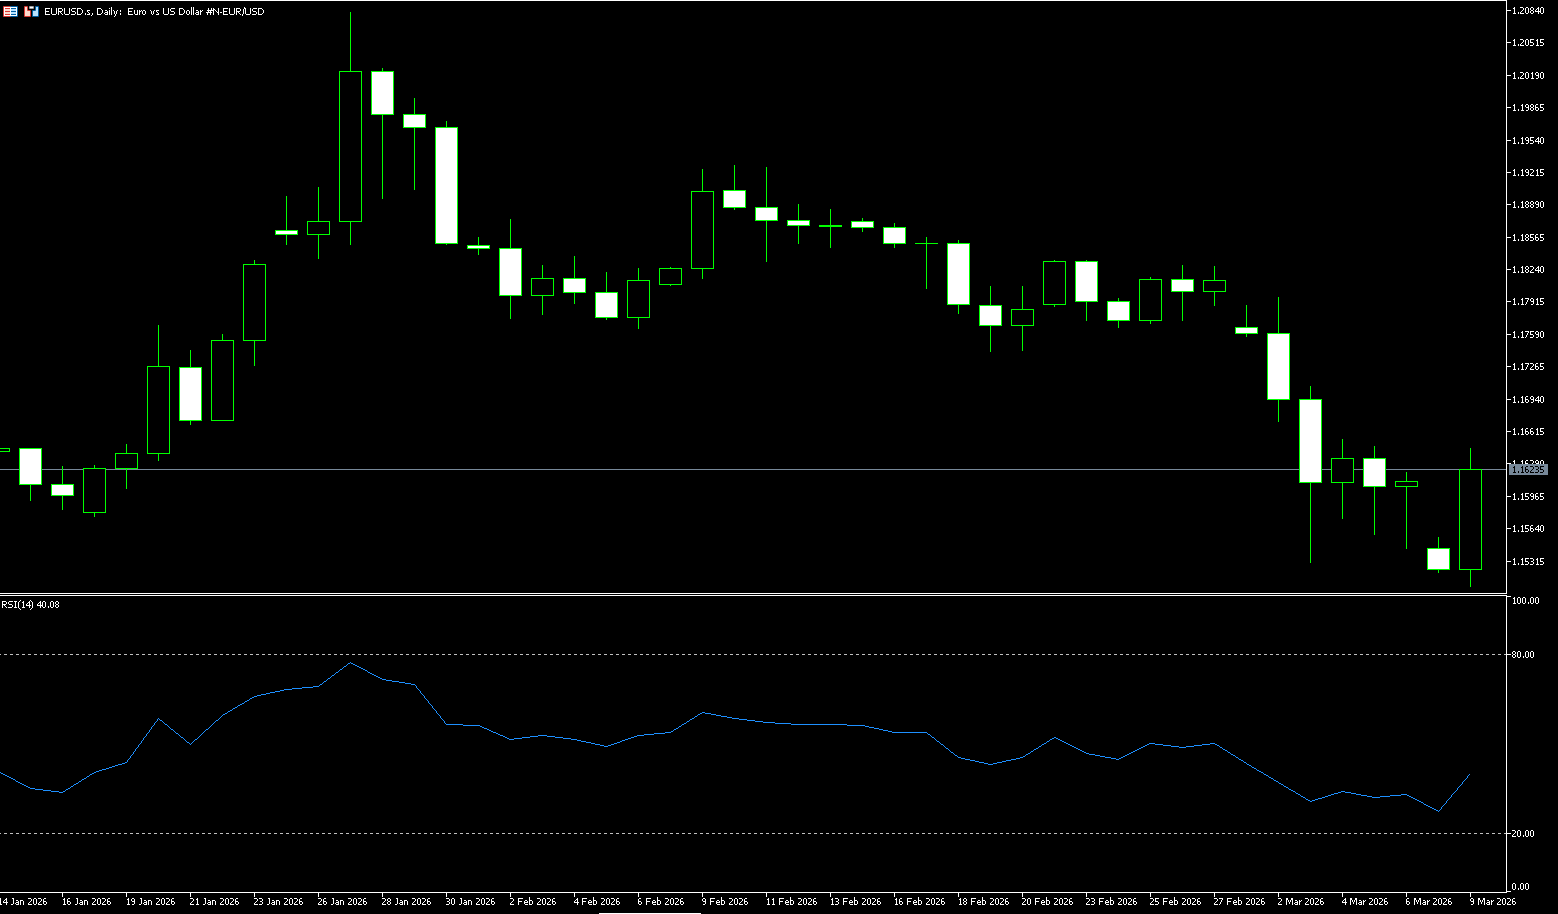
The euro's weakness was due to two main factors: firstly, the strong US dollar pressured the currency in the first half of the week; and secondly, the relatively fragile economic fundamentals of Europe itself, as well as the spillover effects of geopolitical risks. The ongoing conflict in the Middle East pushed up energy prices, diminishing the euro's appeal. The euro suffered a sharp decline against the US dollar this week, falling 1.72% on the week, marking its largest weekly drop since April 2024. Technically, the euro experienced a one-sided downward trend from its high of 1.2082 on January 27th, reaching a low of 1.1507 at the beginning of this week, and has recently been consolidating at lower levels. Although the MACD indicator has formed a golden cross below the zero line, and the red momentum bars are slightly increasing, suggesting a short-term need for a rebound, all moving averages remain in a bearish alignment, with significant resistance levels above. The first is 1.1690 (the 9-day moving average), followed by 1.1707 (the high of March 3rd), indicating that the medium-term downtrend has not yet reversed. On the downside, watch the 1.1596 (9-day moving average) and 1.1500 (psychological level) areas.
Consider going long on the Euro today around 1.1622; Stop loss: 1.1610; Target: 1.1670, 1.1680
Disclaimer: The information contained herein (1) is proprietary to BCR and/or its content providers; (2) may not be copied or distributed; (3) is not warranted to be accurate, complete or timely; and, (4) does not constitute advice or a recommendation by BCR or its content providers in respect of the investment in financial instruments. Neither BCR or its content providers are responsible for any damages or losses arising from any use of this information. Past performance is no guarantee of future results.
Lebih Liputan


Pendedahan Risiko:Instrumen derivatif diniagakan di luar bursa dengan margin, yang bermakna ia membawa tahap risiko yang tinggi dan terdapat kemungkinan anda boleh kehilangan seluruh pelaburan anda. Produk-produk ini tidak sesuai untuk semua pelabur. Pastikan anda memahami sepenuhnya risiko dan pertimbangkan dengan teliti keadaan kewangan dan pengalaman dagangan anda sebelum berdagang. Cari nasihat kewangan bebas jika perlu sebelum membuka akaun dengan BCR.
BCR Co Pty Ltd (No. Syarikat 1975046) ialah syarikat yang diperbadankan di bawah undang-undang British Virgin Islands, dengan pejabat berdaftar di Trident Chambers, Wickham’s Cay 1, Road Town, Tortola, British Virgin Islands, dan dilesenkan serta dikawal selia oleh Suruhanjaya Perkhidmatan Kewangan British Virgin Islands di bawah Lesen No. SIBA/L/19/1122.
Open Bridge Limited (No. Syarikat 16701394) ialah syarikat yang diperbadankan di bawah Akta Syarikat 2006 dan berdaftar di England dan Wales, dengan alamat berdaftar di Kemp House, 160 City Road, London, City Road, London, England, EC1V 2NX. Entiti ini bertindak semata-mata sebagai pemproses pembayaran dan tidak menyediakan sebarang perkhidmatan perdagangan atau pelaburan.

 English
 简体中文
简体中文
 繁體中文
繁體中文
 Bahasa
Melayu
Bahasa
Melayu
 Tiếng
Việt
Tiếng
Việt
 ไทย
ไทย
 日本語
日本語
 한국어
한국어
 ភាសាខ្មែរ
 español