


0
US Dollar Index
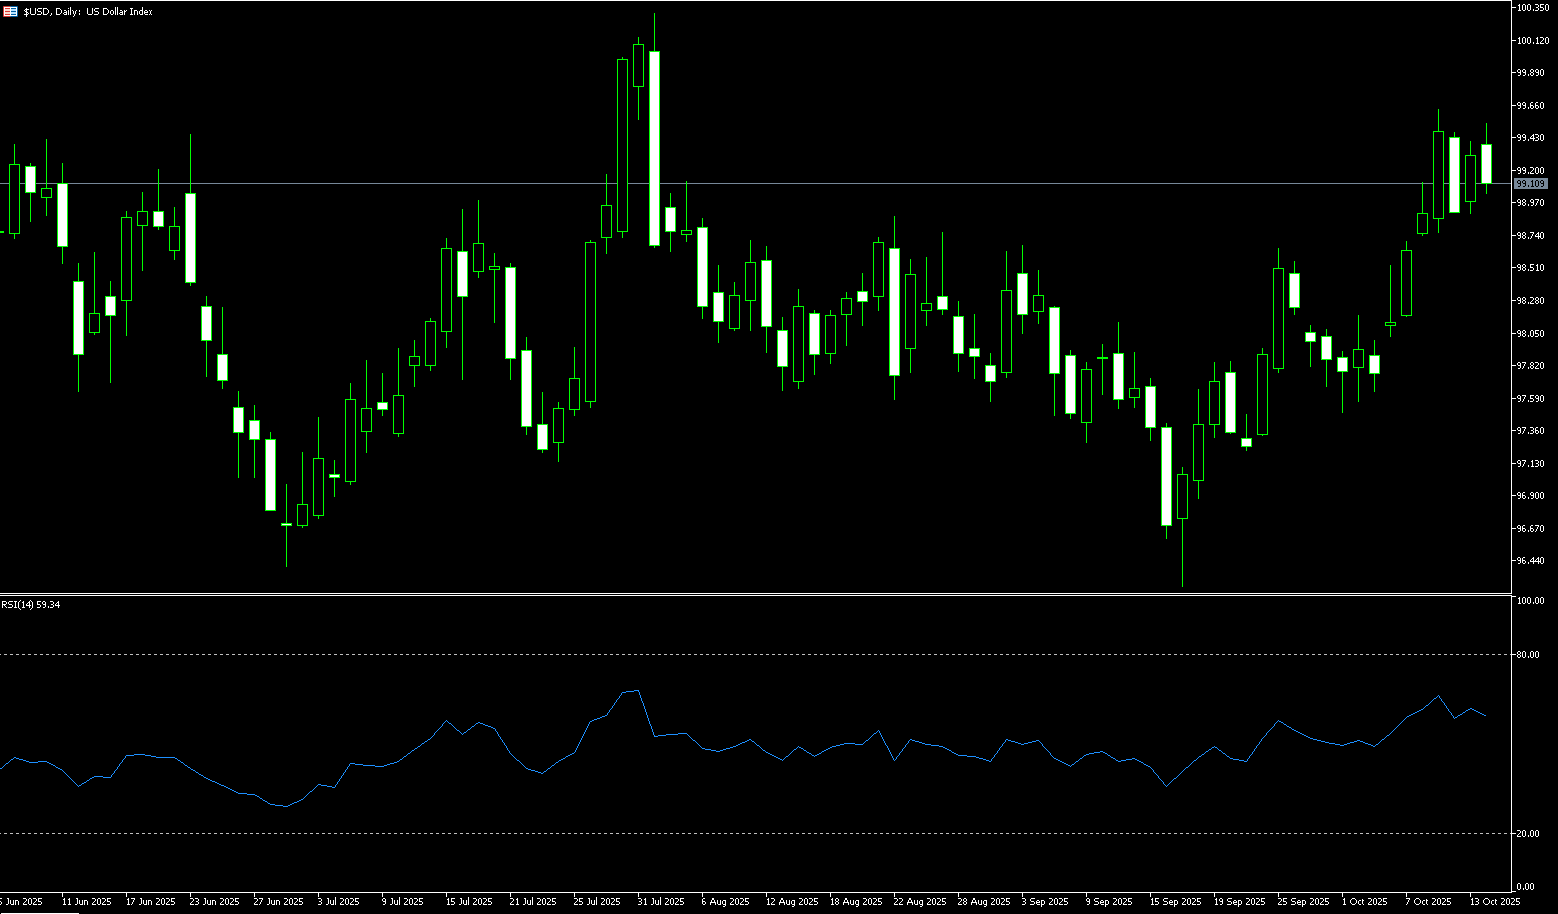
The US dollar index hovered around 99.00 on Tuesday, signaling a lack of direction among investors as they awaited a speech from Federal Reserve Chairman Powell later in the day. Traders are currently rebalancing their risk exposure. However, the dollar's rebound suggests a shift in market sentiment. U.S. Treasury Secretary Scott Bessant's comments on Monday eased investor concerns about the trade situation. While these comments have slowed the dollar's upward momentum, they are still putting pressure on risk-sensitive currencies. A resurgence in foreign exchange volatility could disrupt carry trade strategies as risk appetite remains fragile. Neither the United States nor China can maintain a high-intensity tariff regime without incurring economic losses, increasing the risk of abrupt adjustments in foreign exchange positions, particularly in low-yielding funding currencies such as the Japanese yen and Swiss franc.
Early this week, Trump's trade rhetoric and low holiday liquidity pushed the index back above 99.00. Technically, the 14-day relative strength index (RSI) on the daily chart is above 60, indicating strengthening short-term upward momentum. Initial resistance for the US Dollar Index lies at last week's high of 99.56. A break above this level could open an upward path for the index, potentially heading towards the psychologically important 100.00 level. On the downside, support lies primarily at 98.65 (the 9-day simple moving average), followed by 98.24 (the 50.0% Fibonacci retracement level from 100.26 to 96.22), and then the 98.00 round-figure level.
Consider shorting the US Dollar Index at 99.15 today, with a stop-loss at 99.25 and targets at 98.70 or 98.60.
WTI Spot Crude Oil
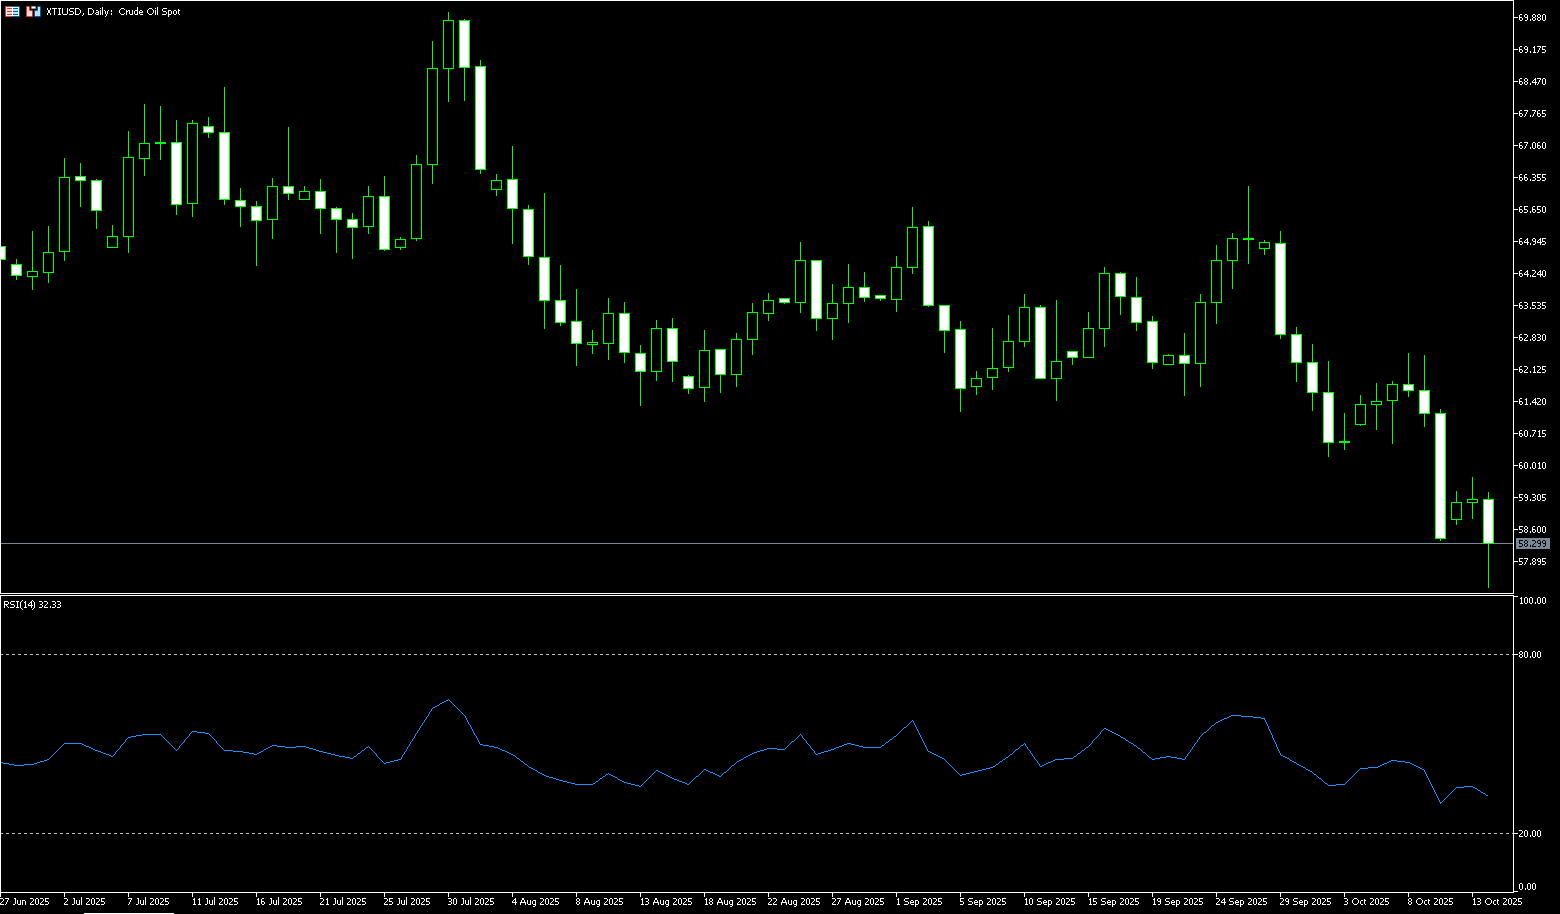
WTI crude oil fell over 2% on Tuesday, plummeting to $57.70 per barrel, a five-month low, after the International Energy Agency's market outlook reinforced expectations of growing oversupply. The International Energy Agency (IEA) raised its forecast for global oil supply growth to 3 million barrels per day this year and 2.4 million barrels per day in 2026, driven by increased production from OPEC+ and strong output in the Americas. At the same time, the agency lowered its two-year demand growth forecast to approximately 700,000 barrels per day. The agency warned that global inventories could swell as bulk crude oil shipments arrive at key hubs, with inventories already increasing in China and the United States. OPEC signaled in its monthly report on Monday that global demand will grow by 1.3 million barrels per day this year and 1.4 million barrels per day in 2026, sending a positive signal. Meanwhile, escalating US-China trade tensions and heightened market risk sentiment have exacerbated selling pressure.
The current rebound in oil prices is more a correction of excessive pessimism than a trend reversal. Focus on negotiation developments and OPEC+ supply changes over the next two weeks. If policy tightens again or the US dollar strengthens, WTI crude oil could retest below the $59 mark. From a daily chart perspective, WTI crude oil, after a rapid decline, has found temporary support near $57.00, posting a slight technical rebound. The price has now rebounded from its previous oversold level, but has yet to break through the psychologically critical resistance level of $60.00 and the $61.48 (14-day simple moving average) resistance zone. The 14-day relative strength index (RSI) has rebounded from 31.05 to around 38.50, indicating a weakening of short-term selling pressure, but the trend remains bearish. If the price fails to consolidate above $60, the rebound may struggle to sustain. Downward support is expected between $56.00 (round mark) and $55.14 (May 5 low). Overall, the technical outlook suggests a weak recovery pattern, so caution is advised in short-term trading.
Consider going long on crude oil at 58.00 today. Stop-loss: 57.80. Target: 59.60, 60.00.
Spot Gold
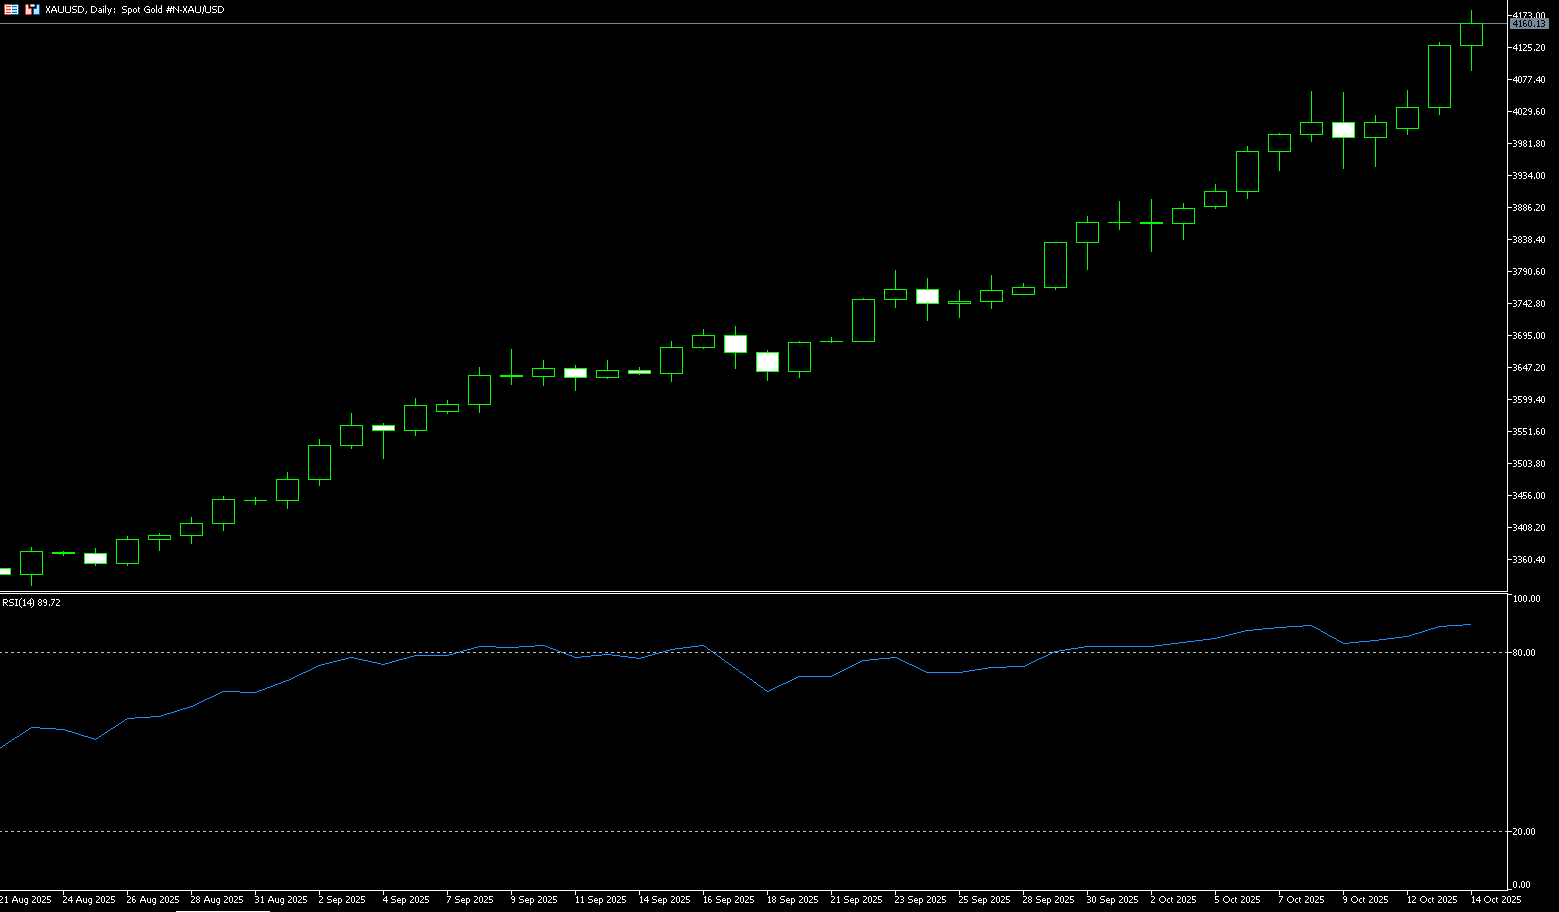
Spot gold traded around $4,140/oz in early European trading on Tuesday. Earlier, gold prices hit a new all-time high of around $4,179.60/oz, driven by renewed trade tensions and expectations of a US interest rate cut. Driven by geopolitical and economic uncertainty, expectations of a US rate cut, and strong central bank buying, gold has climbed 56% year-to-date, breaking through the $4,000 mark for the first time last week. Gold prices experienced rapid price corrections on Monday, Thursday, and Friday, retreating before quickly reversing course. Yesterday, gold hit a new all-time high near $4,179.60, extending its upward trend for the ninth consecutive week, supported by strong safe-haven demand. Gold's upward momentum is likely to continue. By the end of 2026, we could see prices surpass $5,000. Steady central bank purchases, unwavering ETF inflows, trade tensions, and the prospect of lower US interest rates all provide structural support to the market.
Gold's technical outlook remains firmly bullish, extending gains above $4,100. A daily close above this level could confirm further upward momentum, paving the way for a test of the $4,180 and $4,200 levels. Momentum indicators reinforce the bullish bias, with the 14-day relative strength index (RSI) remaining above 80 in overbought territory, indicating strong buying pressure. However, a reading above 80 could indicate an overextension of the uptrend. Meanwhile, a daily close below $4,100 could pave the way for range-bound trading between the previous all-time high of $4,059 and a new all-time high of $4,179. A break below the former could see a drop to $4,000, with further downside targeting the October 10 peak, which turned into support at $3,975.
Consider going long on gold at 4,137 today, with a stop-loss at 4,132 and a target of 4,168 or 4.175.
AUD/USD
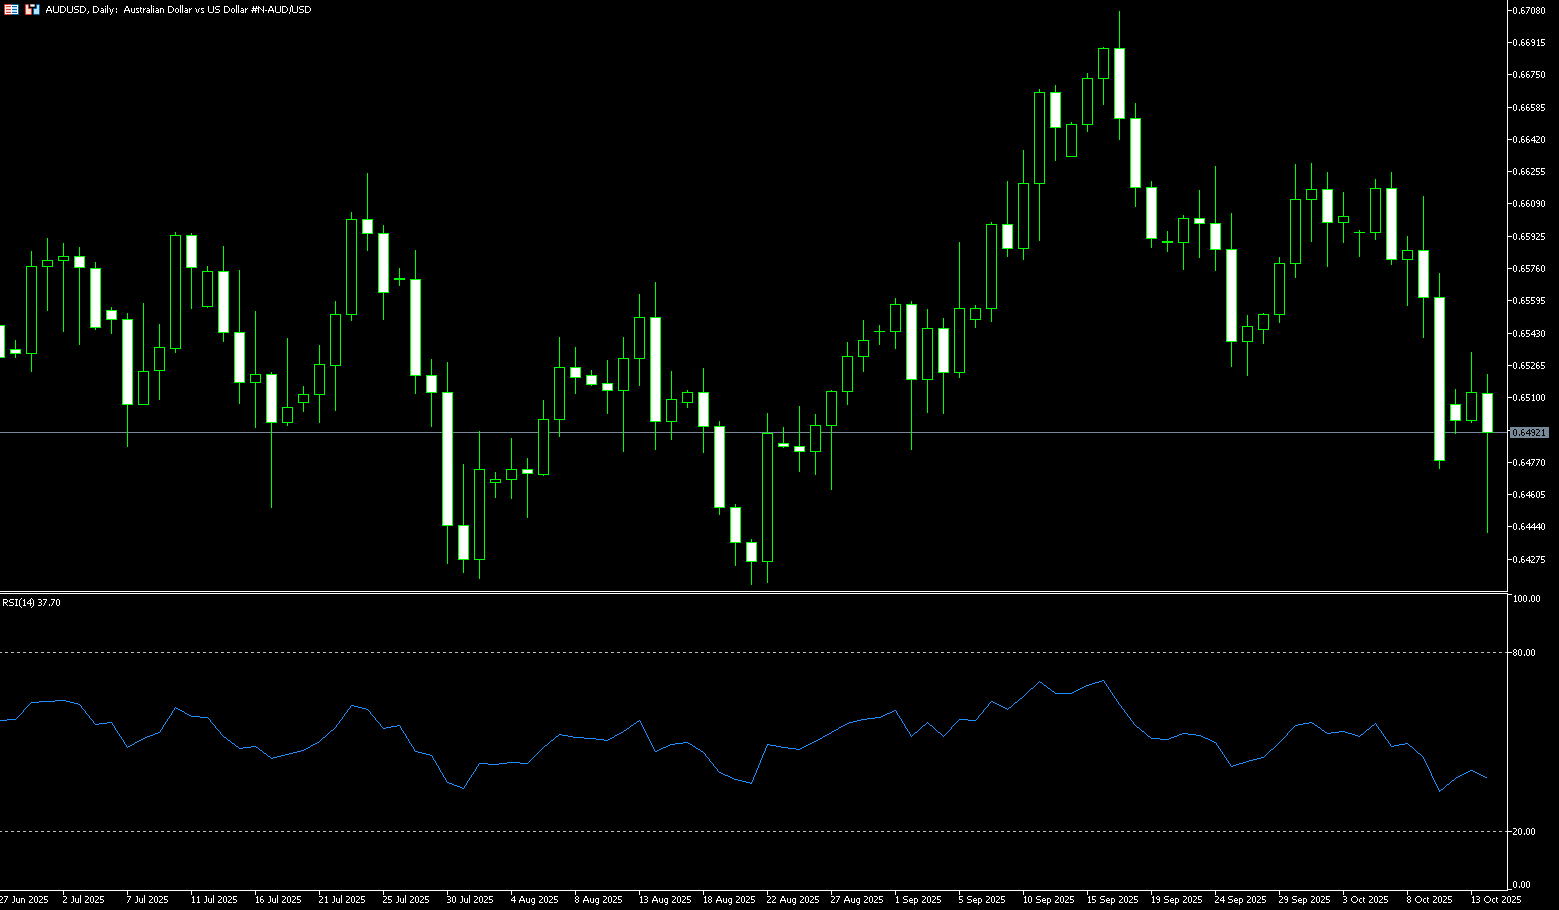
The Australian dollar fell against the US dollar on Tuesday. AUD/USD saw little movement following the release of the Reserve Bank of Australia (RBA)'s (RBA) September monetary policy meeting minutes, which showed that board members agreed that policy remained slightly tight, but uncertain. The RBA minutes also noted that economic risks remain, with consumption remaining weak amid slowing employment and wage growth. Monthly CPI data for housing and services suggests that inflation may exceed expectations in the third quarter. Market sentiment remained cautious after RBA Governor Michelle Bullock stated last week that services inflation remained persistent. She acknowledged that inflation in the second quarter was slightly higher than expected, but still moving in the right direction. Australian consumer inflation expectations rose to 4.8% in October, further reinforcing the Reserve Bank of Australia's cautious outlook.
Daily chart technical analysis shows that the Australian dollar hit another near two-month low of 0.6449 against the US dollar on Tuesday. A bearish bias currently exists as the pair moves downward within a descending channel pattern. Furthermore, the 14-day relative strength index (RSI) remains below 45, further reinforcing the bearish bias. On the downside, the pair could target the 200-day simple moving average at 0.6423. A break above this support level would strengthen the bearish bias and prompt a test of the four-month low of 0.6414 set on August 21, followed by the 0.6400 round-figure mark. Initial resistance lies around 0.6500 (round-figure mark), followed by the 9-day simple moving average at 0.6553. A break above these levels would improve short- and medium-term price momentum and could lead AUD/USD to test the psychological resistance level of 0.6600.
Consider a long position on the Australian dollar at 0.6470 today, with a stop loss of 0.6460 and a target of 0.6530 or 0.6540.
GBP/USD
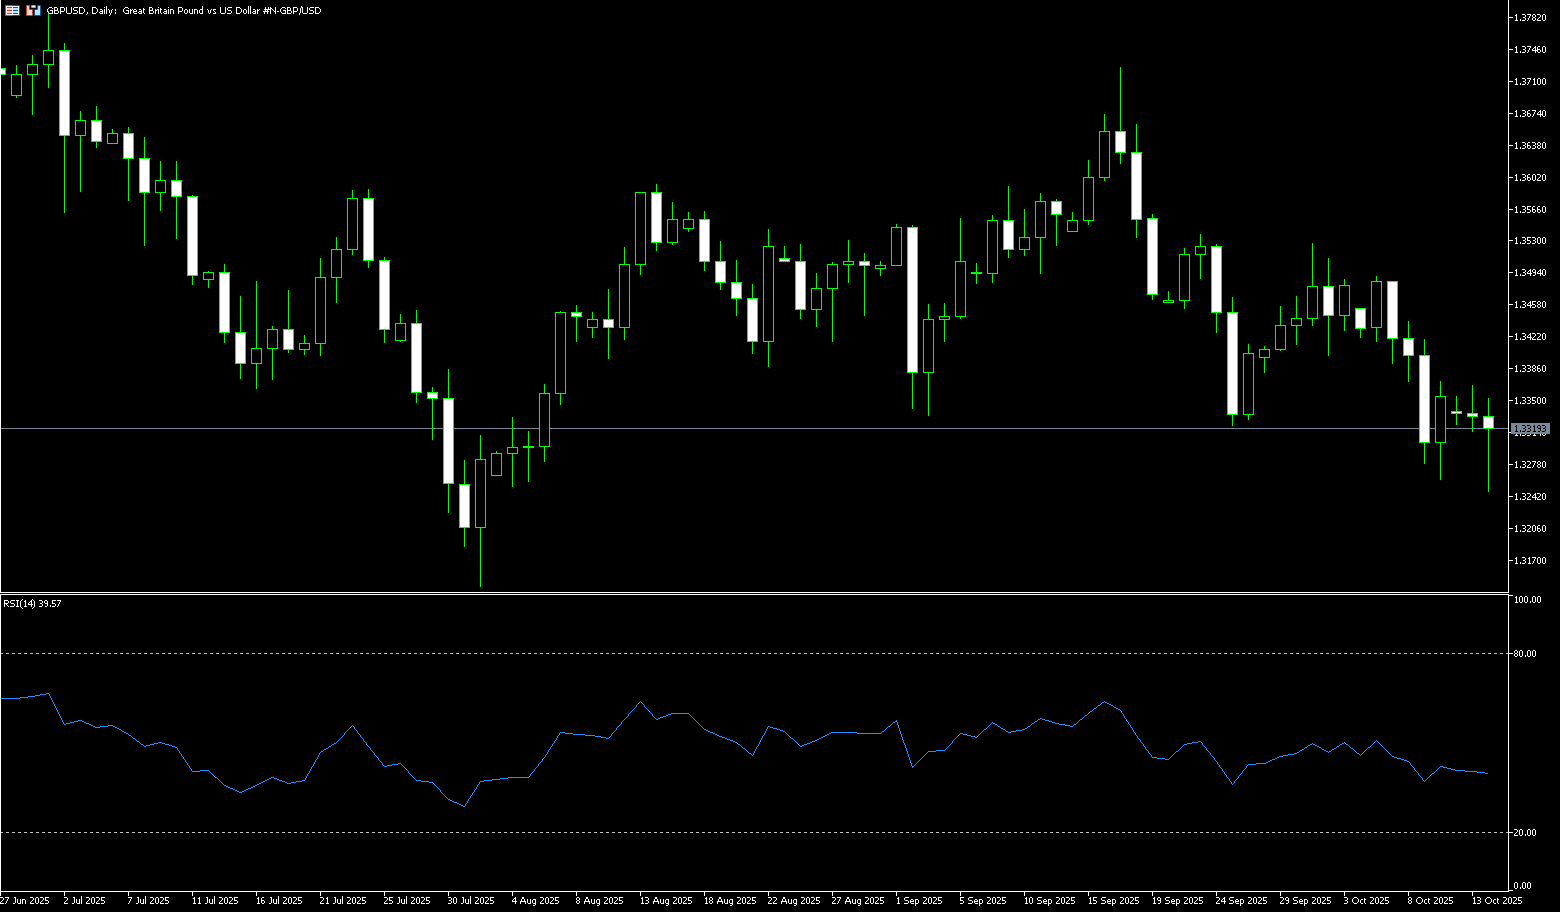
The British pound fell at the start of the week, weighed down by a stronger dollar and investor caution ahead of the UK's November budget. Markets are concerned that potential tax increases to meet fiscal targets could further strain the fragile UK economy. Chancellor of the Exchequer Rachel Reeves is expected to emphasize fiscal discipline in her budget on November 26th, likely through tax hikes, following her previous £25 billion increase in employer social security contributions. The Bank of England will next meet on November 6th, with markets anticipating no change in interest rates, with the first rate cut not expected until March at the earliest. Persistent inflation in wages and services remains a challenge. Meanwhile, the US dollar strengthened after President Trump softened his tariff stance on Beijing. From a recent technical perspective, GBP/USD is trading in a neutral to bearish direction.
On the daily chart, the pair remains below its 20-day (1.3441), 50-day (1.3476), and 100-day (1.3492) simple moving averages, indicating short- and medium-term seller dominance. Furthermore, the 14-day Relative Strength Index (RSI) is below 45.00 and showing a bearish, downward trend, suggesting further downside for the British pound. If GBP/USD falls below the 1.3300 round-figure mark, the next support level will be 1.3261 (the low of October 10), followed by 1.3200 (the round-figure mark). On the other hand, if the pair breaks back above 1.3400, key resistance levels will emerge: 1.3441 (the 20-day), 1.3476 (the 50-day), and 1.3492 (the 100-day simple moving average).
Consider going long on the British pound at 1.3305 today, with a stop-loss at 1.3295 and targets at 1.3365 and 1.3375.
USD/JPY
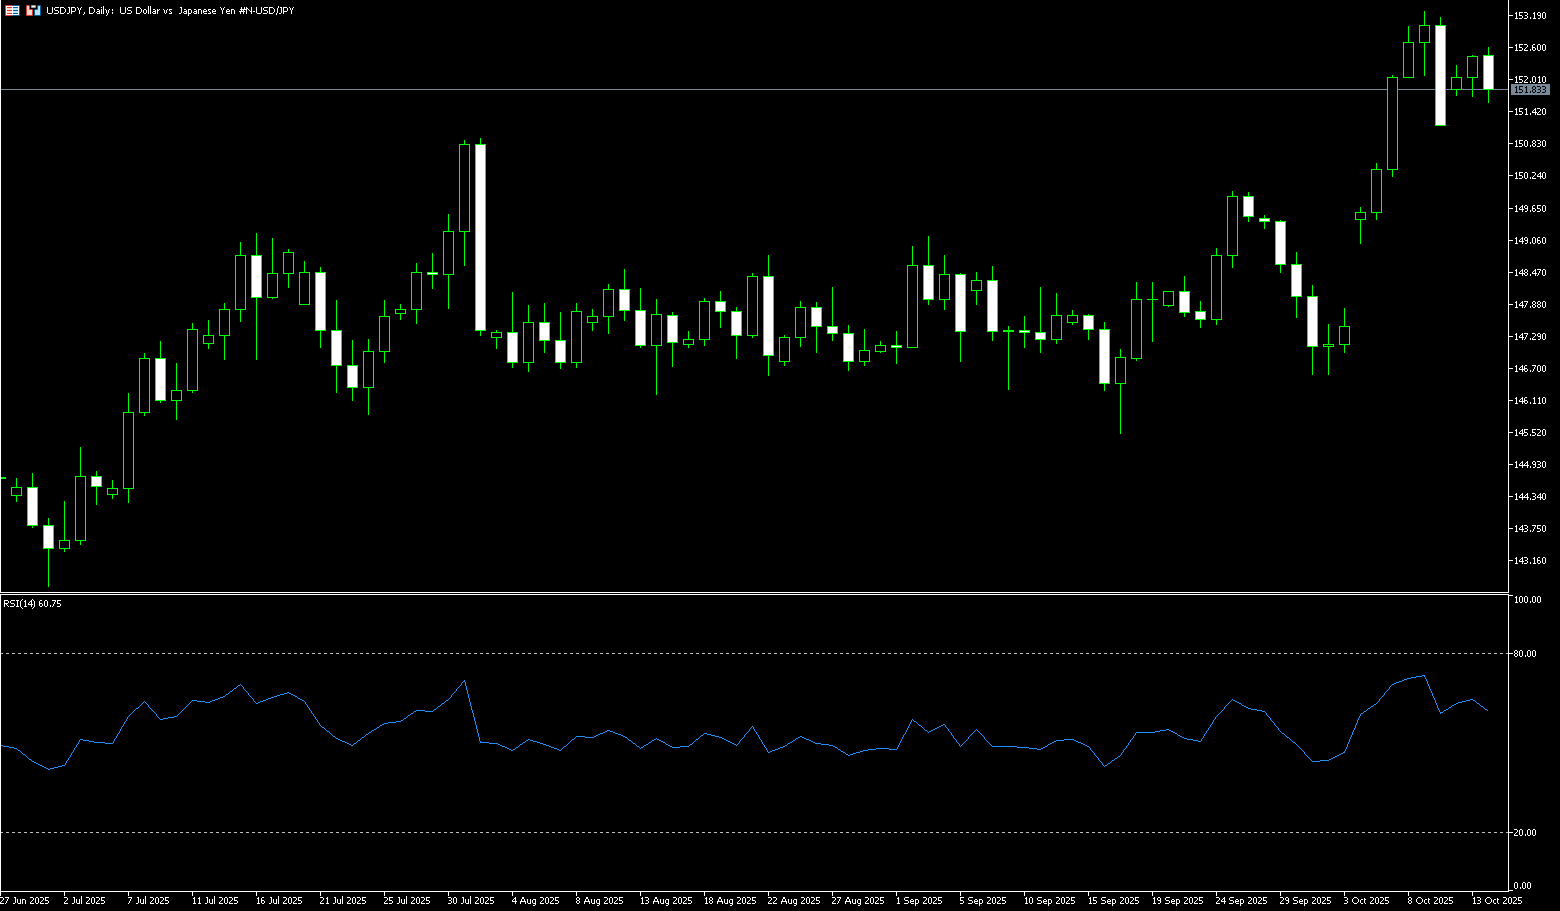
The yen fell for a second consecutive day on Tuesday, as markets anticipated that domestic political turmoil could further delay the Bank of Japan's interest rate hikes. Furthermore, optimistic market sentiment is seen as weakening the yen's safe-haven status. This, coupled with a modest rise in the US dollar, helped the USD/JPY pair continue its climb during the Asian session, reclaiming the mid-152.00 level. Meanwhile, traders are pricing in the possibility of an imminent Bank of Japan rate hike before the end of the year. This diverges significantly from the consensus market expectation of two more Federal Reserve rate cuts by 2025, which could pose headwinds for the US dollar. Furthermore, the divergence in policy expectations between the Bank of Japan and the Federal Reserve could provide some support for the low-yielding yen, limiting losses. However, growing political uncertainty could pose challenges for further Bank of Japan rate hikes and continue to weaken the yen.
From a technical perspective, the daily chart shows that USD/JPY has been struggling to reclaim the 153 round number. However, the 14-day Relative Strength Index (RSI) technical indicator supports the possibility of further appreciation. Some follow-through buying above the resistance level of 152.70-152.75 would confirm the positive outlook and push the spot price back up to 153.00, towards the eight-month high of 153.25-153.30 reached last Friday. On the other hand, a break below the Asian session low could find some support around 151.61 and 151.66 (the 23.6% Fibonacci retracement level from 146.59 to 153.23). Any further decline is more likely to attract some buyers around the 151.15 area (last Friday's swing low). A successful break below this level could accelerate the decline, breaking below the intermediate support of 150.70 and testing the psychological level of 150.00.
Consider shorting the US dollar at 152.00 today. Stop-loss: 152.25, target: 151.00, 150.80.
EUR/USD
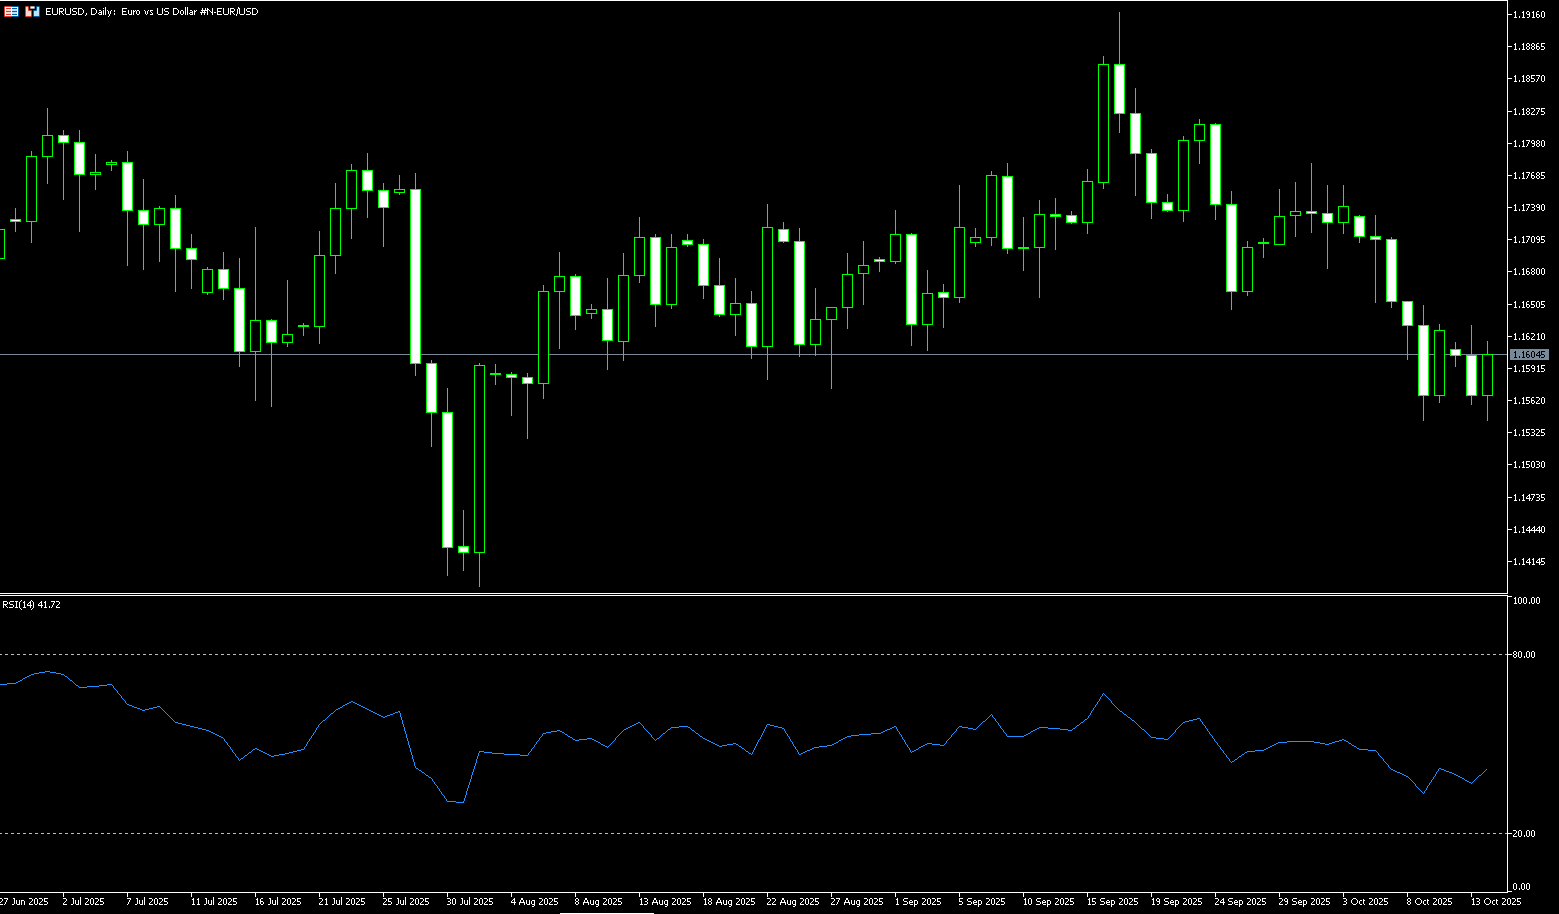
EUR/USD rebounded slightly on Tuesday, trading just above 1.1600 after retesting a two-month low of 1.1542 earlier in the day. Risk aversion due to concerns about the US-China trade war weighed on the euro, while Germany's ZEW economic confidence index failed to boost investor sentiment. Furthermore, the EUR/USD pair weakened due to ongoing political turmoil in France. President Emmanuel Macron reappointed Sébastien Le Cornu as Prime Minister, and Le Cornu has formed a new cabinet. However, opposition leaders Marine Le Pen and Eric Sciotti have filed a motion of no confidence seeking to overthrow Le Cornu's government. The US dollar remained subdued, supporting the pair, as the likelihood of further Federal Reserve rate cuts by year-end increased. The dollar also came under pressure due to the impact of the ongoing US government shutdown on the US economy, prompting traders to adopt a cautious approach.
The daily chart shows that EUR/USD has turned bearish in the short term after breaking below the 9-day SMA at 1.1642 and the psychologically important 1.1600 area. The 14-day Relative Strength Index (RSI) has fallen below 40.00, suggesting that downward momentum is building. Currently, key support for the pair lies at 1.1550, the 150-day SMA, and the October 9 low near 1.1542. A break below these levels would expose the 1.1500 round-figure mark, and the 155-day SMA at 1.1457. On the upside, resistance lies at the psychologically important 1.1600 level. A decisive break above 1.1600 could pave the way for a test of the 9-day SMA at 1.1642 and the 1.1700 area.
Today, you can consider going long on EUR at 1.1600, stop loss: 1.1585, target: 1.1650; 1.1660
Disclaimer: The information contained herein (1) is proprietary to BCR and/or its content providers; (2) may not be copied or distributed; (3) is not warranted to be accurate, complete or timely; and, (4) does not constitute advice or a recommendation by BCR or its content providers in respect of the investment in financial instruments. Neither BCR or its content providers are responsible for any damages or losses arising from any use of this information. Past performance is no guarantee of future results.
Lebih Liputan


Pendedahan Risiko:Instrumen derivatif diniagakan di luar bursa dengan margin, yang bermakna ia membawa tahap risiko yang tinggi dan terdapat kemungkinan anda boleh kehilangan seluruh pelaburan anda. Produk-produk ini tidak sesuai untuk semua pelabur. Pastikan anda memahami sepenuhnya risiko dan pertimbangkan dengan teliti keadaan kewangan dan pengalaman dagangan anda sebelum berdagang. Cari nasihat kewangan bebas jika perlu sebelum membuka akaun dengan BCR.

 English
 简体中文
简体中文
 繁體中文
繁體中文
 Bahasa
Melayu
Bahasa
Melayu
 Tiếng
Việt
Tiếng
Việt
 ไทย
ไทย
 日本語
日本語
 한국어
한국어
 ភាសាខ្មែរ
 español