


0
Dollar Index
The dollar index fell to around 99.39 on Wednesday, its third straight decline and a more than two-week low, as concerns about the U.S. economic and fiscal outlook intensified. Pressure on the dollar intensified as President Trump failed to convince Republican opponents to support his comprehensive tax bill, fueling doubts about fiscal stability, after Moody's recently downgraded the U.S. sovereign credit rating due to rising debt and widening deficits. In addition, federal officials on Tuesday doubled down on concerns about the impact of the Trump administration's trade policies on the economy, with St. Louis Fed President Alberto Musalem warning of a weak labor market and rising prices, while Cleveland Fed President Beth Hammack warned of potential stagflation. Traders are now focusing on the upcoming bilateral meeting between U.S. Treasury Secretary Scott Bessant and Japanese Finance Minister Katsunobu Kato at the G7 finance ministers' summit in Canada this week.
From the daily structure, the US dollar index has fallen below 100.13 and 100.00 (market psychological barriers) of the Bollinger Band center axis. In the short term, it is under pressure at 101.60 (upper Bollinger Band line) and 101.65 (55-day simple moving average), indicating that bears are dominant. The 14-day relative strength index (RSI) of the technical indicator is now around 42, suggesting that the short-term trend is neutral and weak, and has not entered the oversold area, and there is still room below. In terms of support, the 99.17 (May 6 low) and 99.00 (integer barrier) support levels are under pressure, and if more selling pressure appears, they may break at any time. There may be a sharp drop to the low of 97.91 at the beginning of the year and the key level of 97.73. On the upside, 100.00 (psychological level), and 100.13 (Bollinger Band center axis) are the first big resistance levels to face, and if the dollar bulls push the dollar index further up, the key resistance level of 100.68 will come into consideration.
Today, consider shorting the dollar index around 99.75, stop loss: 99.90, target: 99.30, 99.20

WTI spot crude oil
WTI crude oil prices rose sharply during the Asian trading session on Wednesday after CNN reported that US intelligence showed that Israel was preparing for a possible attack on Iran's nuclear facilities. A month-high of $64.00 was seen. Multiple US officials familiar with the latest intelligence told CNN that the United States has obtained new intelligence indicating that Israel is preparing to attack Iran's nuclear facilities, even as US President Trump has been seeking a diplomatic agreement with Tehran. The American Petroleum Institute (API) weekly report showed that US crude oil inventories increased by 2.499 million barrels in the week ending May 16, compared with an increase of 4.287 million barrels in the previous week. Moody's downgraded the US credit rating from 'Aaa' to 'Aa1', citing the failure of successive US governments to reverse the ballooning deficit and interest costs. This has raised questions about the economic health of the world's largest oil consumer, which may limit the upside of black gold.
The short-term rise in US crude oil has been affected by the increased tensions in the Middle East and reinforced by the decline in API inventories. Although the technical structure is conducive to the continuation of bulls, the market is still highly dependent on the direction of geopolitical news evolution. From the daily chart, WTI crude oil prices have successfully broken through the market psychological barrier of $60 and the $60.67 {20-day simple moving average} area level, and closed three positive lines in a row, showing that bulls are dominant. The MACD indicator forms a golden cross, and the momentum column continues to expand. In the short term, it is expected to challenge the high resistance area of 64.00 and 64.71 dollars {April 23 high} on Wednesday. If it stands firmly, it will further open up the upward space, and the target may be 65.61 dollars {75-day simple moving average}. However, it is necessary to be vigilant that if the news is exhausted, if the price falls below the support of 61.09 dollars {25-day simple moving average} and 61.00 dollars {integer mark}, there is a risk of callback to the psychological mark of 60.00 dollars.
Today, you can consider going long on crude oil around 61.00, stop loss: 60.80; target: 62.50; 62.80

Spot gold
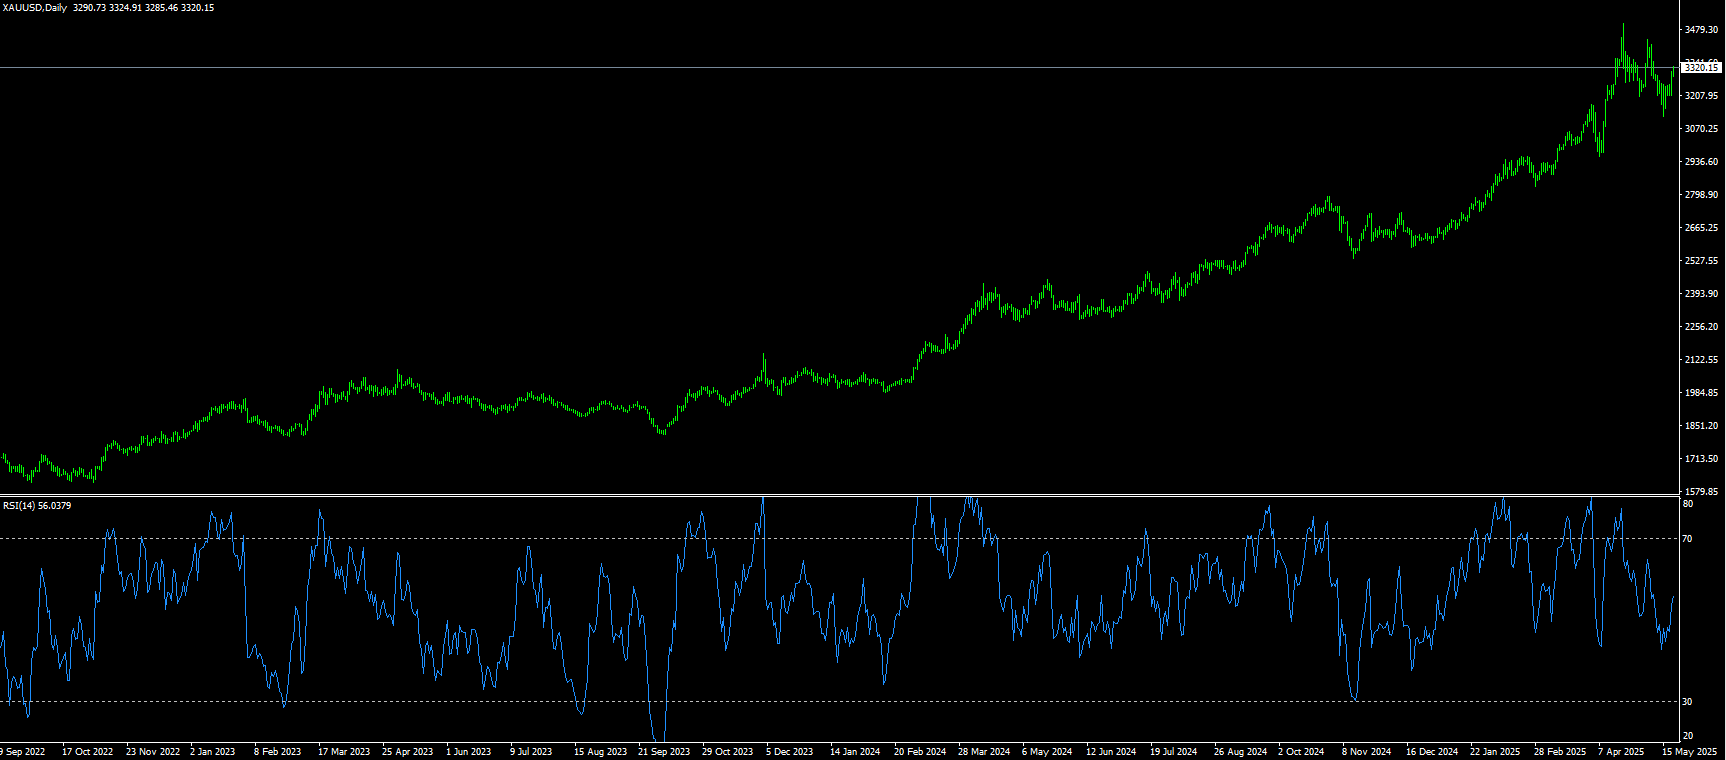
On Wednesday, spot gold opened at $3,320 after breaking through $3,300. It is currently trading around $3,310. Due to geopolitical tensions, according to US intelligence, Israel is preparing to strike Iran's nuclear facilities. In addition, Moody's downgraded the US rating, which supported the gold price due to the weakening of the US dollar. There is still a certain degree of uncertainty in the market. Most obviously, Moody's downgrade and the weakening of the US dollar have supported the precious metals market as a whole. The continued tension between Russia and Ukraine has a certain influence on the trend of gold, because the failure to reach any potential agreement may mean a reduction in market supply from Russia. On Tuesday, the European Union and the United Kingdom announced new sanctions against Russia without waiting for the United States to join. The day before, US President Trump had a phone call with Russian President Putin, but failed to obtain a commitment to a ceasefire in Ukraine.
Gold prices are expected to continue their rebound and negate the "head and shoulders" chart pattern that appeared five days ago. As the price of gold continues to record consecutive higher highs and lower lows, the gold/dollar pair could reach around the $3,350 level in the short term. The momentum is biased towards buyers, as shown by the 14-day relative strength index (RSI) of the daily chart technical indicator. That is, once gold breaks above $3,300, the next resistance level will be around the $3,324 {May 12 high} level. The next level is the psychological level of $3,350, followed by the round number level area of $3,400. A break above the latter would expose the May 7 high of $3,438, followed by $3,500. Conversely, if gold falls below $3,250 {9-day simple moving average}, the next support level will be the $3,200 mark, followed by the 50-day simple moving average of $3,184.50.
Consider going long on gold before 3,300 today, stop loss: 3,305; target: 3,330; 3,335
AUD/USD
AUD/USD rose to a high of around $0.6458 on Wednesday, supported by a weaker U.S. dollar as concerns about the economic and fiscal outlook resurfaced. This came after cautious comments from the Federal Reserve and uncertainty over President Trump's tax cut proposals. Meanwhile, the Australian dollar came under pressure on Tuesday as the Reserve Bank of Australia cut interest rates as expected and signaled downside risks to the economy. Policymakers noted that inflation continued to slow and upside risks declined, with core inflation forecasts remaining near the midpoint of the 2-3% target. The RBA also highlighted that global trade tensions could weigh on growth, further supporting the case for further rate cuts and weighing on the currency. Political instability in Australia also weighed on the Australian dollar. The opposition coalition disintegrated after the National Party withdrew from a coalition with the Liberal Party. Meanwhile, the ruling Labor Party took advantage of the turmoil to return to power with a stronger and broader mandate.
AUD/USD traded around 0.6440 on Wednesday, with technical indicators on the daily chart reflecting a bullish tone. The pair continues to trade above the 20-day simple moving average of 0.6423, while the 14-day relative strength index (RSI) remains above the neutral 50 level - both signals support continued upward momentum. On the upside, immediate resistance is seen at the upper Bollinger Band line of 0.6487 on the daily chart. A break above this barrier could open the way to a test of 0.6500, and the six-month high of 0.6515 set on December 2, 2024. Initial support is seen at the 0.6400 level, followed by the 34-day simple moving average around 0.6354. A firm break below the above levels would weaken the bullish outlook in the short to medium term, potentially opening the way to 0.6300.
Today, it is recommended to go long on the Australian dollar before 0.6425, stop loss: 0.6410, target: 0.6470, 0.6480

GBP/USD
GBP/USD continued its rise for the third trading day in the Asian session on Wednesday, trading at a high of around 1.3468. It hit its highest level in more than three weeks and once broke through the seven-month high of $1.3445 reached in April as investors became optimistic ahead of key British economic data and a major political breakthrough with the European Union. At the beginning of the week, the UK and the EU reached a landmark agreement to reset their post-Brexit relationship. The agreement includes cooperation on energy, defense and reciprocal fishing rights until 2038. In addition, investors will pay close attention to Thursday's preliminary PMI data, which is expected to show a smaller contraction in the manufacturing industry and a milder decline in the service industry. The core CPI may reach 3.6%. Despite fragile consumer confidence, retail sales are expected to increase by 0.4%, achieving growth for four consecutive months. Meanwhile, the dollar weakened as Moody's unexpectedly downgraded the U.S. government's credit rating, citing concerns about rising debt.
Technical analysis on the daily chart suggests that the ongoing bullish bias remains as the pair remains within an ascending channel pattern. GBP/USD continues to rise above the 9-day simple moving average of 1.3311, indicating stronger short-term price momentum. Moreover, the 14-day relative strength index (RSI) of the technical indicator rose above 50, further reinforcing the bullish bias. GBP/USD faces immediate resistance at 1.3445, a level reached on April 28, the highest since February 2022. A break above this level could improve market sentiment and support the pair to explore the 1.3500 mark. On the downside, GBP/USD is likely to find Tuesday's low of 1.3335, and the 9-day simple moving average of 1.3311 as the main support areas, followed by the lower line of the ascending channel at 1.3270. A successful break below this key support zone could weaken the bullish bias and exert downward pressure on the pair to test the psychological barrier level of 1.3200.
Today's recommendation is to go long GBP before 1.3410, stop loss: 1.3400, target: 1.3450, 1.3460

USD/JPY
The yen broke through 144 yen per dollar to 143.45 yen on Wednesday, marking its seventh consecutive trading day of strength as investors digested Japanese trade data while awaiting progress from the G7 meeting. Although Tokyo's trade deficit narrowed sharply in April 2025, it defied market expectations for a surplus. Exports grew for the seventh consecutive month, but the growth rate was the slowest in the current sequence, raising concerns about the upcoming US tariffs. Meanwhile, imports fell for the second month of the year, although the decline was smaller than expected. People are also paying attention to the G7 finance ministers' summit that started in Canada on Tuesday and will last until Thursday, and the focus of discussions is expected to be on the economic turmoil caused by the US tariff policy and the war in Ukraine. On the sidelines of the summit, Japanese Finance Minister Katsunobu Kato is scheduled to meet with US Treasury Secretary Scott Bessant for discussions that may include recent currency market volatility.
From a technical perspective, the intraday decline has taken USD/JPY below the 144.00 confluence point, with a three-week low of 143.45 seen. Moreover, oscillators on the daily chart have just begun to gain negative momentum, supporting further short-term depreciation. A clear break below the 144.00 mark would further confirm the bearish outlook, potentially exposing the 143.20 area, the 61.8% Fibonacci retracement of the 139.89 to 140.65 range, as well as the 143.00 {round number} area, followed by the 142.42 {May 7 low} level. On the other hand, the Asian session highs around the 144.55 area now appear to be an immediate obstacle, a break of which could see the USD/JPY pair re-target the 145.00 psychological mark. However, any subsequent gains may still be seen as selling opportunities and are capped around 145.27 {38.2% Fibonacci retracement}. The latter should serve as a pivotal point, a sustained breakout of which could shift the short-term bias in favor of bullish traders.
Today's recommendation to short USD before 143.80, Stop Loss: 144.00; Target: 142.80, 142.60

EUR/USD
EUR/USD gathered strength around 1.1330 during early European trading on Wednesday. Extending the recovery from the one-month low hit on May 12, it was supported by the general weakness of the US dollar. The decline in the US dollar was due to Moody's decision to downgrade the US credit rating by one notch from Aaa to Aa1, citing growing concerns over rising government debt and widening fiscal deficits. The downgrade raised concerns about the potential economic impact on the US and put pressure on US assets. Meanwhile, the EU and the UK reached a tentative agreement in key areas such as defense and security cooperation, fisheries, and youth mobility ahead of the upcoming EU-UK summit on Monday. According to EU officials, the agreement could allow UK companies to participate in important EU defense contracts, marking a step forward in post-Brexit relations. On the monetary policy front, the ECB is expected to continue to cut interest rates in June, with the possibility of further easing thereafter.
Technically, the constructive outlook for EUR/USD remains as the major currency pair consolidates above the 9-day simple moving average of 1.1197 on the daily chart. The technical upside momentum on the daily chart is reinforced by the 14-day relative strength index (RSI), which is above the midline near 55.70, indicating bullish momentum in the short term. On the positive side, the first upside resistance is seen at 1.1381, the high of May 6. A break above this level could gain more momentum towards 1.1456, the upper line of the Bollinger Band. Further up, the next resistance level is 1.1574, the high of April 21. In the bearish case, 1.1255 (the middle axis of the Bollinger Band) is the initial support level. A break below this level may drag the major currency pair to 1.1200 (the round number mark) and the 1.1197 area level of the 9-day simple moving average.
Today, it is recommended to go long on the euro before 1.1315, stop loss: 1.1305, target: 1.1370, 1.1380.

Disclaimer: The information contained herein (1) is proprietary to BCR and/or its content providers; (2) may not be copied or distributed; (3) is not warranted to be accurate, complete or timely; and, (4) does not constitute advice or a recommendation by BCR or its content providers in respect of the investment in financial instruments. Neither BCR or its content providers are responsible for any damages or losses arising from any use of this information. Past performance is no guarantee of future results.
Lebih Liputan


Pendedahan Risiko:Instrumen derivatif diniagakan di luar bursa dengan margin, yang bermakna ia membawa tahap risiko yang tinggi dan terdapat kemungkinan anda boleh kehilangan seluruh pelaburan anda. Produk-produk ini tidak sesuai untuk semua pelabur. Pastikan anda memahami sepenuhnya risiko dan pertimbangkan dengan teliti keadaan kewangan dan pengalaman dagangan anda sebelum berdagang. Cari nasihat kewangan bebas jika perlu sebelum membuka akaun dengan BCR.

 English
 简体中文
简体中文
 繁體中文
繁體中文
 Bahasa
Melayu
Bahasa
Melayu
 Tiếng
Việt
Tiếng
Việt
 ไทย
ไทย
 日本語
日本語
 한국어
한국어
 ភាសាខ្មែរ
 español