0
Currency & Commodity Analysis:
US Dollar Index
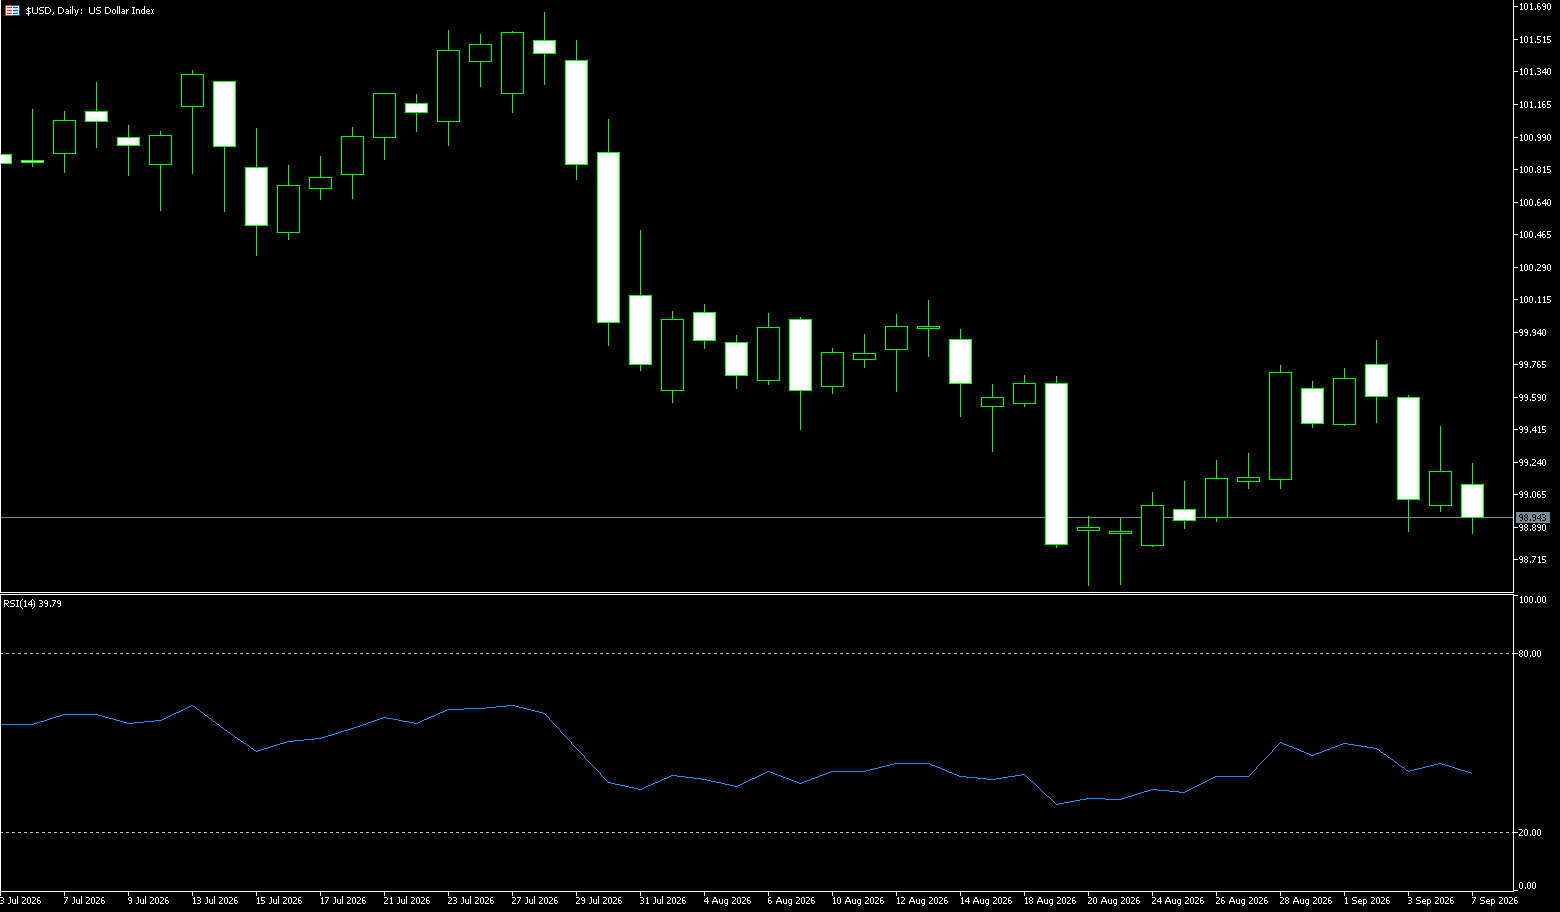
The US dollar index remained slightly below 99 on Monday, after a slight rebound in the previous session, supported by stronger-than-expected US jobs data, which strengthened market expectations for a September rate hike by the Federal Reserve. Data released on Friday showed that US non-farm payrolls increased by 162,000 in August, far exceeding the expected increase of 56,000, following a revised increase of 23,000 in July. Meanwhile, the unemployment rate remained unchanged at 4.1%, and annual wage growth slowed to 3.1%, although the slowdown was less than market expectations. Investors raised the probability of a Fed rate hike in September to about 60%, up from about 50% before the jobs report. Focus now shifts to the upcoming US inflation data this week for further clues about the direction of central bank policy. The dollar also benefited from safe-haven demand, pushing oil prices higher, as the US and Iran attacked ships over the weekend.
The daily chart shows the dollar index spot trading slightly below 99. The short-term tone is bearish, as the index remains below the cluster of 50-day, 100-day, and 200-day simple moving averages around 100.22, as well as below the major uptrend line that previously provided support and is now referenced around 100.15, while the downtrend line extending from 101.80 limits any further upward attempts to around 101.26. The Relative Strength Index (RSI) (14) is around 42, below the midline, suggesting continued downward pressure rather than an imminent bullish reversal. On the upside, initial resistance is near 99.70 (the 100-day moving average), followed by the psychological level of 100.00. On the downside, the first notable support level is the secondary uptrend line near 98.72. A break below this level would expose a lower level to 98.56 (last month's low) and reinforce the current bearish bias.
Consider shorting the US Dollar Index at 99.00 today, with a stop-loss at 99.10 and targets at 98.60 and 98.70.
WTI Spot Crude Oil
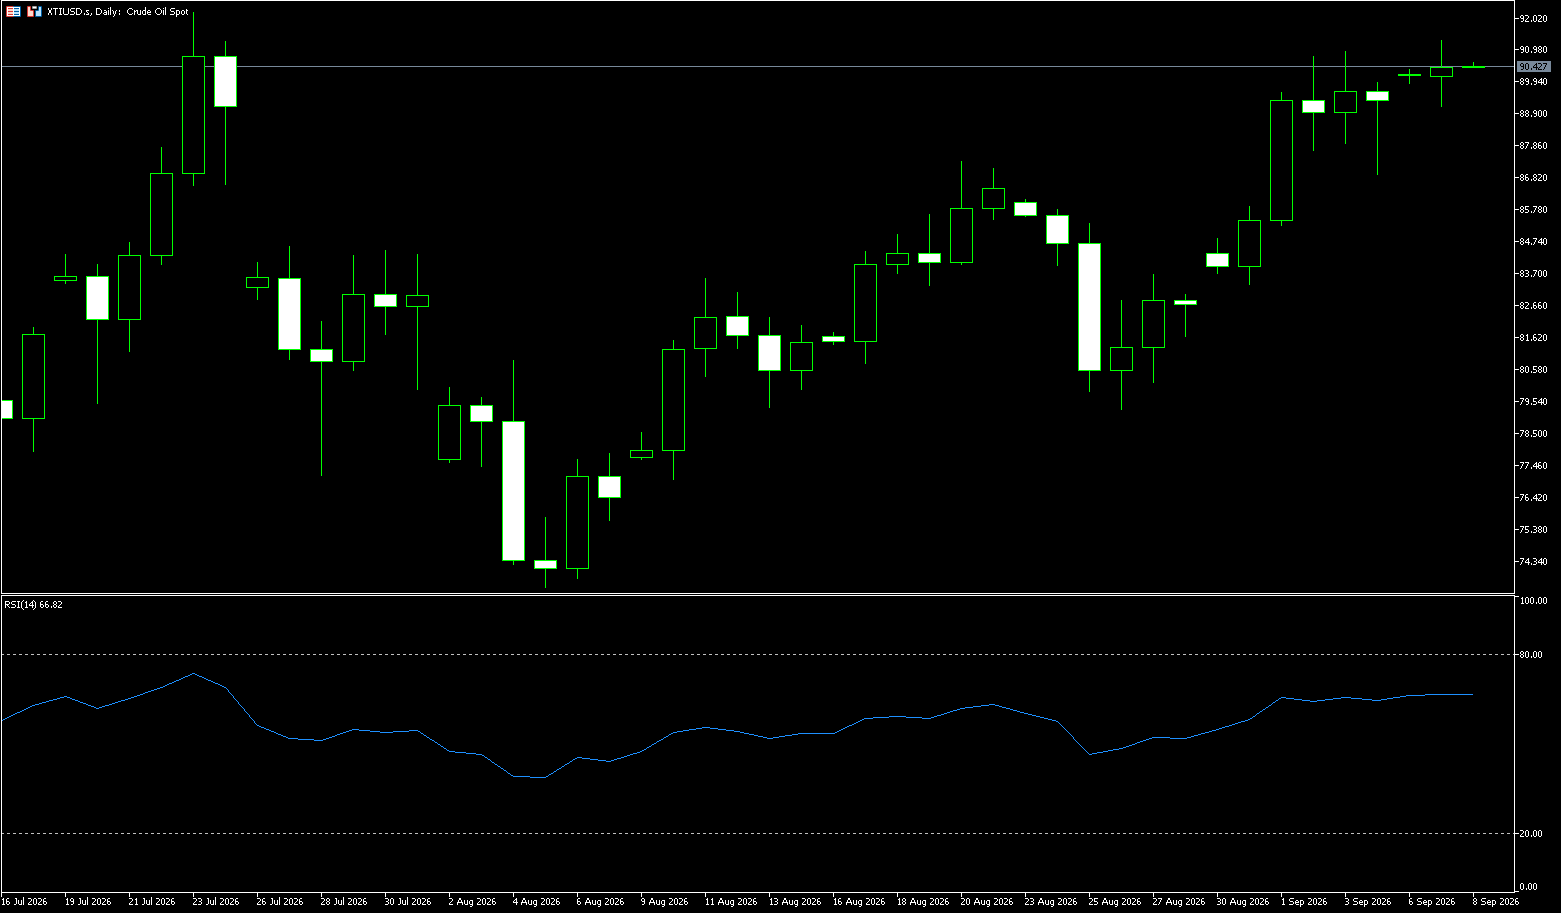
US crude oil traded around $90.50 per barrel. Renewed tensions between the US and Iran, with clashes between US and Iranian forces in the Strait of Hormuz and surrounding waters on Saturday, and the Ukrainian attack on Russian refineries exacerbating supply disruptions, supported oil prices. Brent crude rose 8.59% last week, while US crude rose 7.86%, impacted by supply disruptions caused by ongoing Middle East conflict. Meanwhile, with renewed tensions between the US and Iran and the Ukrainian attack on Russian refineries further exacerbating supply disruptions, the average retail diesel price in the US hit a record high of $5.85 per gallon. The market expects inflation to continue rising. Diesel prices may rise further due to sharply reduced inventories and the harvest and planting season in agricultural states. Citigroup raised its third-quarter average Brent crude oil price forecast to $86 per barrel from $80, citing a longer-than-expected reopening of the Strait of Hormuz. Preliminary shipping data showed only four commodity ships passed through the Strait of Hormuz last Thursday, far below the average of about 15 ships per day over the past 10 days.
Last Week Both Brent and WTI crude oil have completed their consolidation phase after a continuous upward trend. Brent crude oil briefly approached $97 during the session before slightly retreating to around $95.83 on Friday, still recording a weekly gain of nearly 7%. WTI crude oil has shown strong consolidation with four positive and one negative candlestick over the past five trading days, with the price currently about 15% above the 200-day moving average of $78.20. The MACD histogram continues to show a bullish trend, indicating that the bullish momentum has not weakened significantly. Domestic SC crude oil saw a weekly gain of over 11%, outperforming the international market. This indicates that supply concerns within the region are becoming more concentrated. On the upside, the $92.25 (July high) – $94.86 (June high) area is worth considering. A successful break and hold above this level could open up further potential towards the psychologically important $100 level, which has been the previous high. On the downside, key support is around $86.94 (Friday low). A break below this level could lead to a pullback to $85.20 (100-day moving average) to find new buying support.
Today, consider going long on crude oil at $90.60, with a stop-loss at $90.45 and a target of $92.00. 92.80
Spot Gold
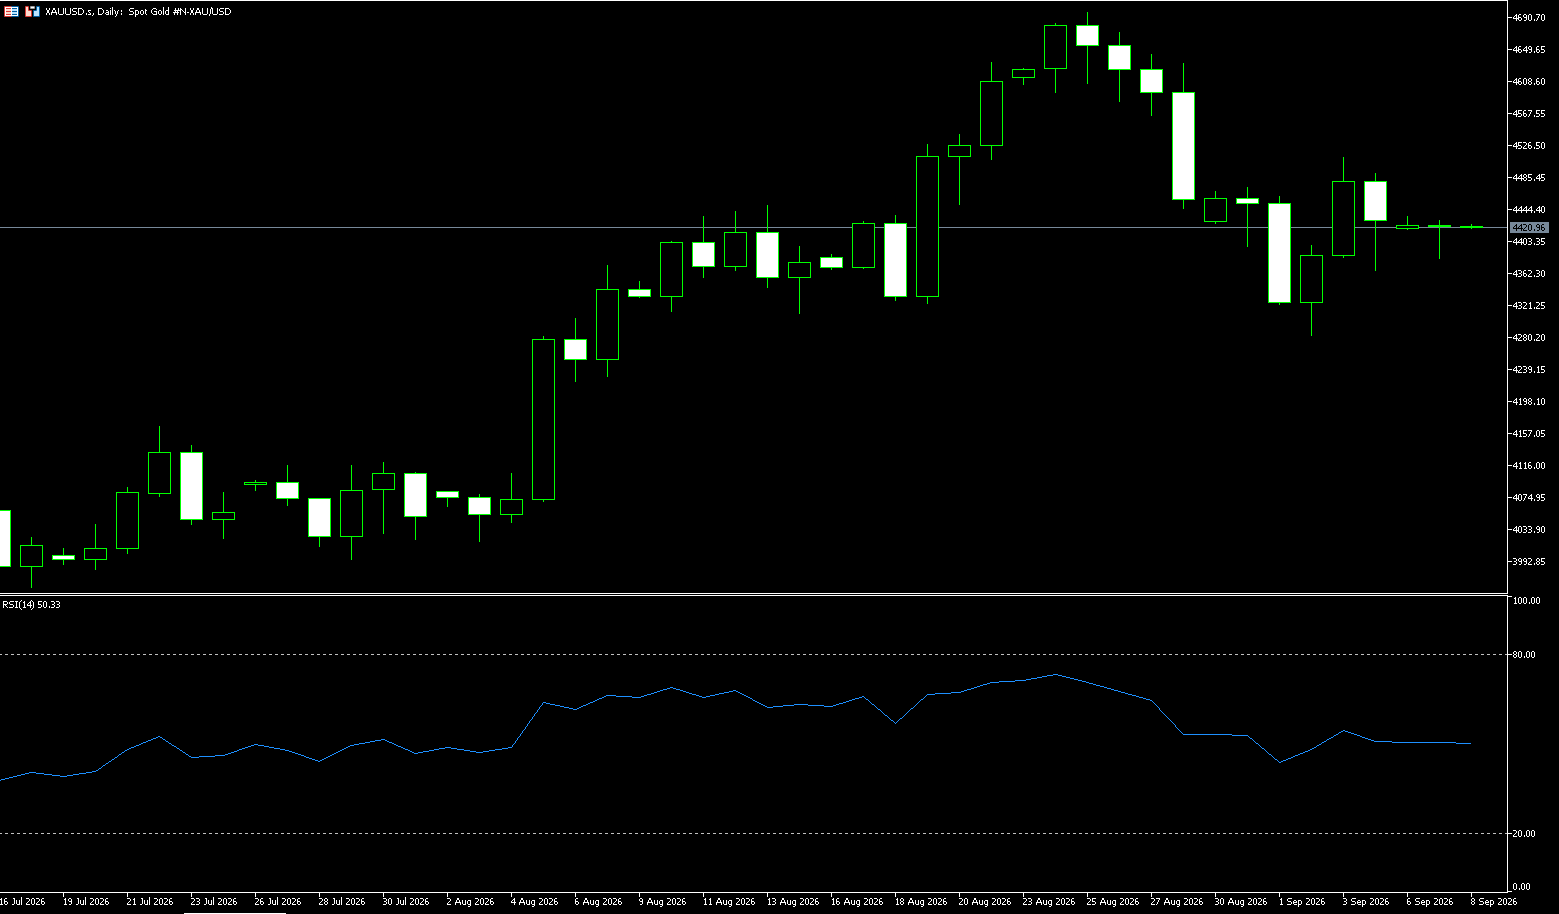
On Monday morning, spot gold traded around $4,410 per ounce, pressured by stronger-than-expected US August jobs data, which strengthened expectations of a Fed rate hike. Gold prices fell more than 1% on Friday, impacted by the same data, resulting in a lower weekly chart. Spot gold fell nearly 1%, closing at $4,430 per ounce, after plunging more than 2% to a daily low of $4,365.50 per ounce during the session, unless this week's Consumer Price Index (CPI) is released. The weak jobs report significantly increased the likelihood of a September rate hike. Market focus has now shifted to the upcoming US CPI and Producer Price Index (PPI) data to further assess the inflation situation and the Fed's policy path. Against the backdrop of Fed Chairman Warsh's hawkish speech in Jackson Hole, this jobs report further cleared the way for the Fed to implement its rate hike stance, while this week's CPI data could still trigger greater volatility in the precious metals market. Meanwhile, the dollar's sharp rise after the jobs data release also increased the appeal of dollar-denominated gold to overseas investors. Gold is becoming increasingly expensive.
The Relative Strength Index (RSI) on the daily chart has successfully rebounded above the neutral 50 level after falling below it at the beginning of the week, currently reading around 51.65. Furthermore, despite previously closing below it, gold has regained its position above the 100-day simple moving average (currently around $4350). However, the daily RSI is still flat above 50, and gold prices have not yet effectively broken through the 200-day simple moving average around $4535.80, indicating that buyers remain unwilling to bet on a stable upward trend. On the upside, $4510–$4535 are potential targets. The US dollar (38.2% Fibonacci retracement of the March-August downtrend, 200-day simple moving average) forms a key resistance area. If gold prices can stabilize above this area and confirm it as support, then the $4675–$4700 range (50% Fibonacci retracement, psychological level) is a key resistance zone. On the downside, the first significant support level is seen around $4350 (100-day simple moving average), followed by the $4300–$4295 range (static level, 23.6% Fibonacci retracement).
Consider going long on gold today at $4407, with a stop loss at $4402 and targets of $4450 and $4460.
AUD/USD
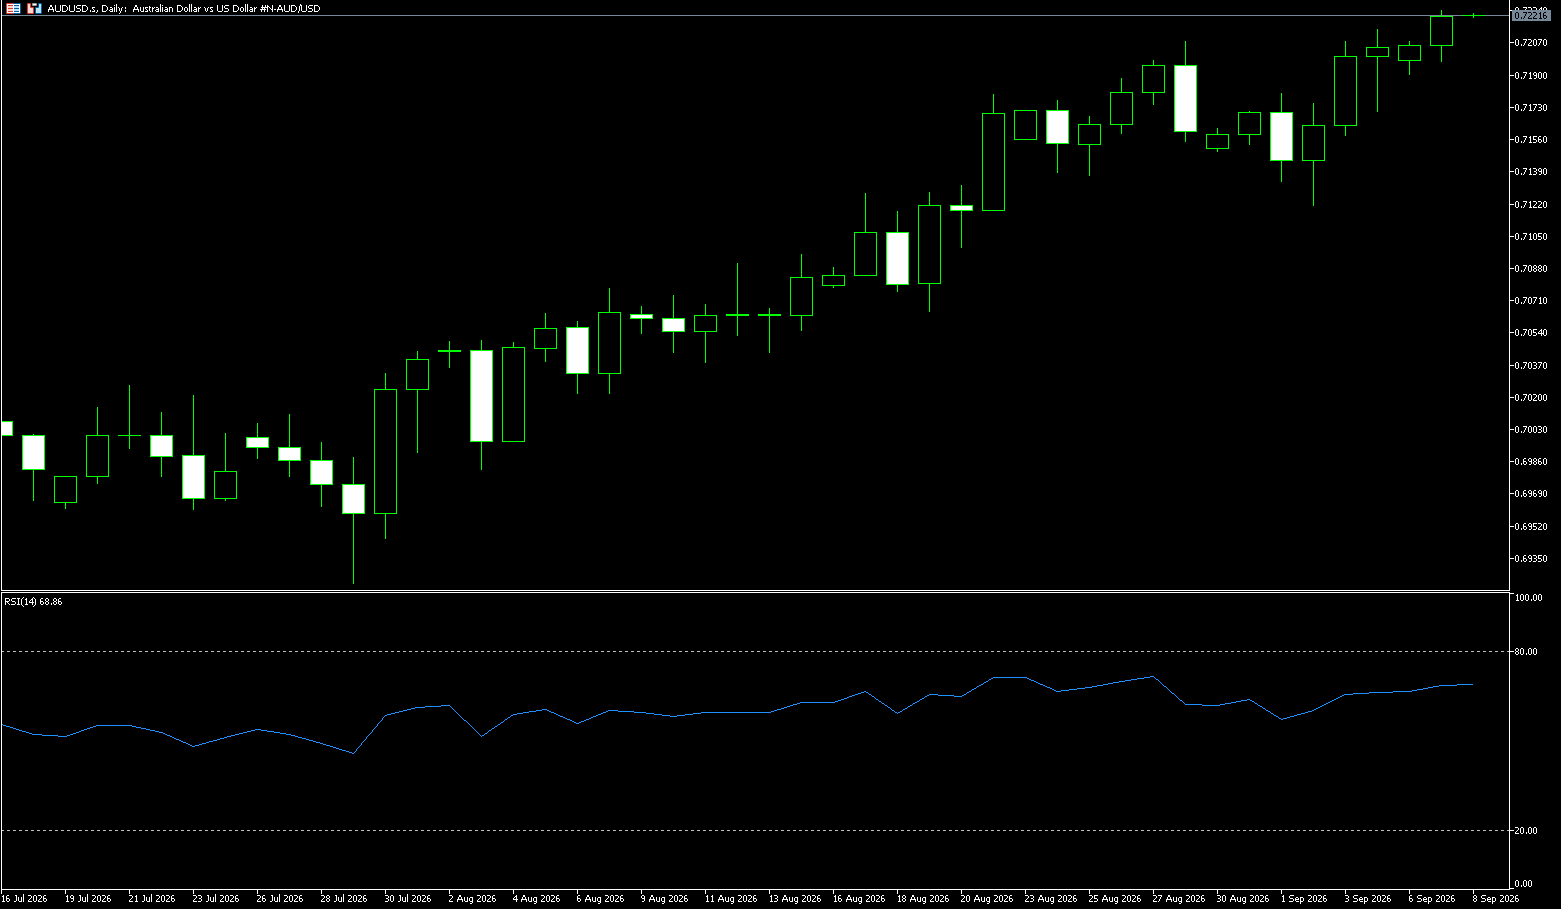
The Australian dollar remains above US$0.72, near a four-month high, supported by increasing market expectations of another rate hike by the Reserve Bank of Australia, while the US dollar has generally weakened. The dollar briefly rebounded after rising rate hike expectations following Friday's strong US jobs report, but failed to sustain the gains. The market remains cautious ahead of Friday's US Consumer Price Index (CPI) report, which could influence expectations regarding the Fed's policy path. In Australia, strong GDP growth and inflation data have increased market expectations for another interest rate hike by the Reserve Bank of Australia later this month. The market now anticipates a 66% probability of a 25 basis point hike to 4.60%, a significant increase from just 10% a few weeks ago, while the probability of a further hike to 4.85% has risen to 50%. Meanwhile, ongoing tensions in the Middle East have exacerbated concerns about broader inflationary pressures, increasing the prospect of the central bank continuing to tighten policy.
On the daily chart, the AUD/USD exchange rate is trading around 0.7220, currently holding above the 55-day, 100-day, and 200-day simple moving averages, maintaining a short-term bullish bias. These moving averages are roughly concentrated in the 0.70 to 0.71 range. The 14-day Relative Strength Index (RSI) near 68 indicates robust upward momentum, while the 14-day Average Directional Index (ADX) around 22 suggests the trend is improving but has not yet broken out, providing good support for the pair, but also gradually approaching overbought territory. On the downside, initial support is at 0.7079, with the 100-day moving average at 0.7079, while the 55-day and 200-day moving averages at 0.7031 and 0.6989 respectively provide additional support. On the upside, bulls first face resistance at 7264 (the high of May 14th), followed by the nearby upper limit of 0.7300 (a psychological resistance level).
Consider going long on the Australian dollar at 0.7210 today, with a stop loss at 0.7200 and targets at 0.7260 and 0.7250.
GBP/USD
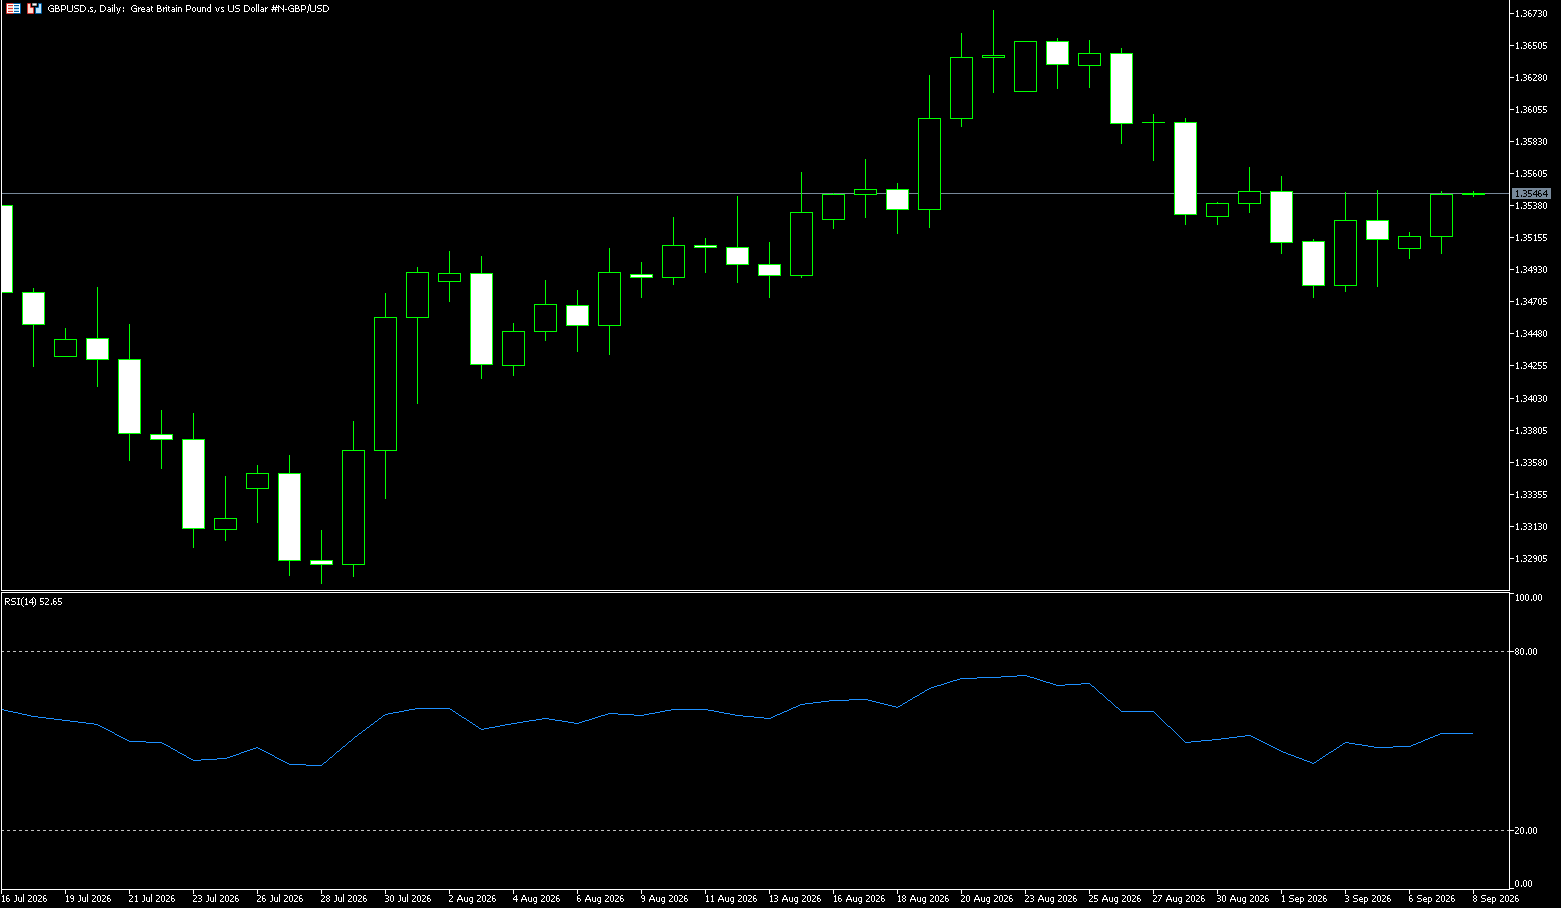
GBP/USD maintained a narrow range-bound bias for the second consecutive trading day, but lacked clear bearish momentum, trading near the psychological level of 1.3500 during Monday's Asian session. Furthermore, the spot price remains above last Friday's swing low, requiring bearish traders to exercise caution. The dollar was supported by rising inflation risks driven by energy prices, which fueled market bets on a September rate hike by the Federal Reserve. Additionally, escalating tensions between the US and Iran in the Strait of Hormuz provided a tailwind for the safe-haven dollar and put pressure on GBP/USD. However, dollar bulls appear hesitant, opting to await US inflation data later this week for further clues about the Fed's policy path. Traders will also face Friday's UK monthly GDP report for further impetus. Meanwhile, relatively thin trading volumes due to the US Labor Day holiday, coupled with traders' reluctance to make aggressive bets, could continue to support GBP/USD.
Technically, GBP/USD is holding above the 200-day simple moving average at 1.3448 and the 38.2% Fibonacci retracement level of the June-August rally. Meanwhile, the Relative Strength Index (RSI) is at 50.47, hovering near neutral territory, and the Moving Average Convergence/Divergence (MACD) line remains slightly negative. This indicates that while GBP/USD is consolidating above these fundamental support levels, upward momentum remains relatively moderate. On the upside, the 23.6% Fibonacci retracement level at 1.3548 is the first resistance level to break, followed by the psychological level around 1.3600; a break above this level would reopen stronger bullish extension potential. On the downside, initial support lies above the 200-day simple moving average at 1.3448 and the 38.2% Fibonacci retracement level of the June-August rally.
Consider going long GBP at 1.3530 today, with a stop-loss at 1.3520 and targets at 1.3570 and 1.3580.
USD/JPY
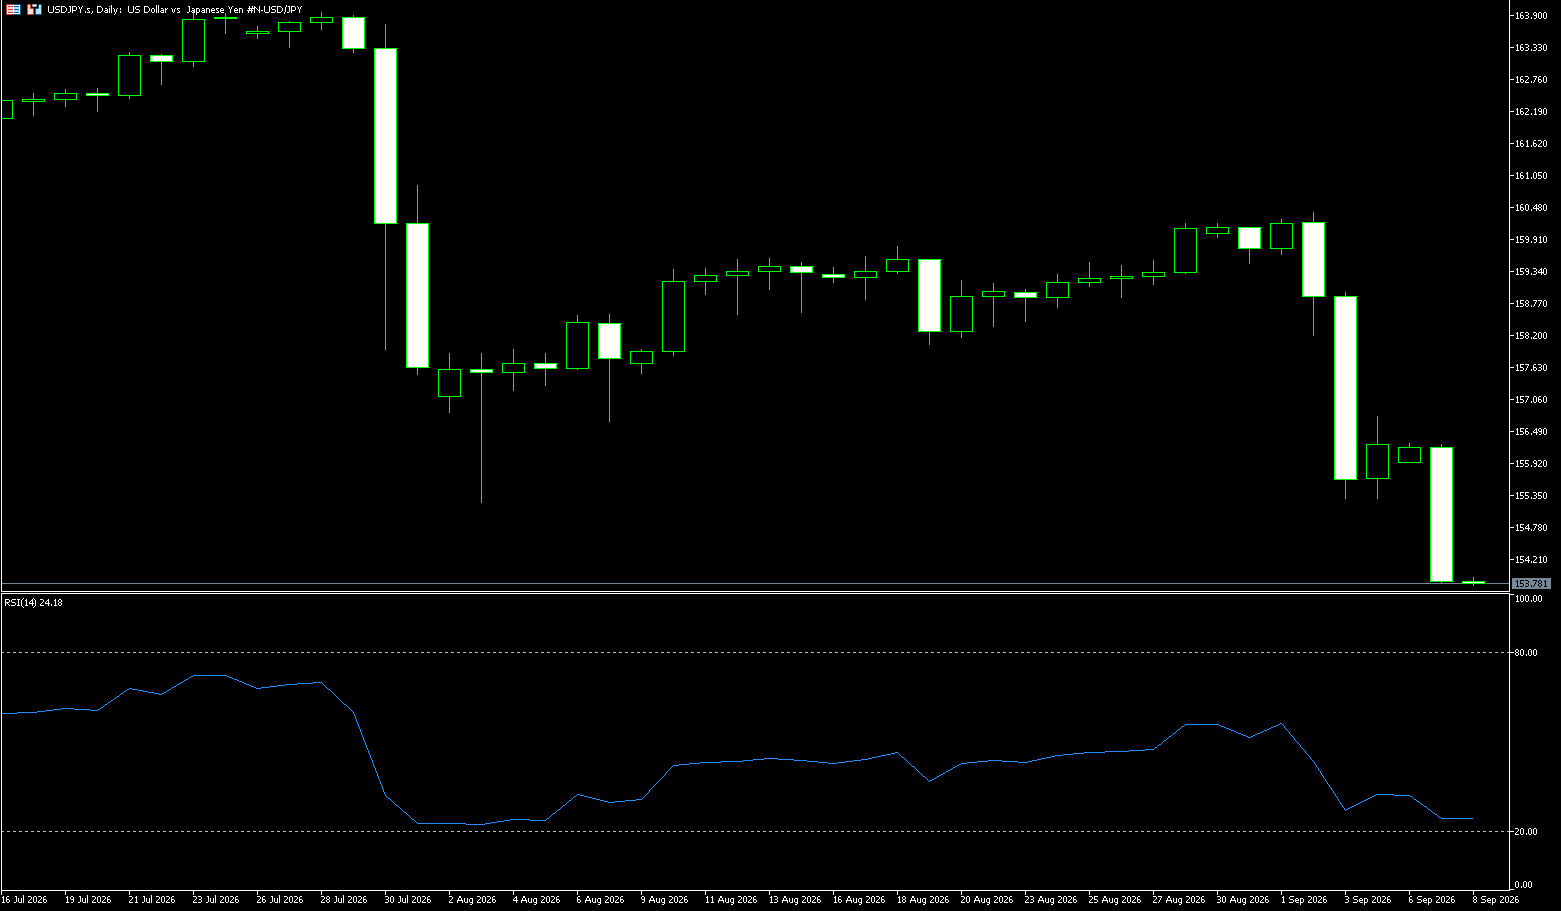
The USD/JPY pair accelerated its decline during Monday's European session, testing 154.00, as the market's repricing of the Bank of Japan's extremely hawkish stance continued to push the yen higher. Meanwhile, the dollar was weighed down by concerns about US debt and uncertainty surrounding the Federal Reserve's policy outlook ahead of Friday's US CPI data release. The pair remained generally strong due to the yen's outperformance of other currencies last week and hawkish comments from Bank of Japan board member Hajime Takada. Significant volatility was observed in the foreign exchange market, particularly the yen's sharp rise from the 160 level on September 2nd to an overnight low of 154.00, a swing of five large psychological levels. A weaker dollar was another trigger for the sharp dollar decline, ruling out the possibility of Bank of Japan intervention. Whether the USD/JPY volatility was driven by foreign exchange intervention is not entirely clear at this time. This movement more broadly reflects the policy context, leaving room for unexpected and consecutive rate hikes. A weaker dollar is another trigger for the sharp dollar decline and rules out the possibility of intervention by the Bank of Japan. Whether the USD/JPY volatility is driven by foreign exchange intervention is not entirely clear at this time.
On the daily chart, USD/JPY is trading near 154.00, a level not seen since February, as the spot price remains well below the 100-day simple moving average at 159.92, indicating a continued bearish bias in the short term. The distance from this simple moving average suggests that a broader uptrend framework remains above the price, with sellers currently in control. The Relative Strength Index (RSI) is around 27, hovering below oversold territory, suggesting that downward momentum has extended significantly but has not yet given a clear reversal signal. On the upside, 155.30 (last Friday's low) is the first major resistance level that bulls need to reclaim, followed by 155.80 (the lower Bollinger Band) to alleviate current downward pressure and reopen a path to higher levels. On the downside, 154.00 (a psychological level) and 153.99 (the low of February 23) are key support areas; a break below these levels could open further downside potential to 153.07 (the low of February 8).
Consider shorting the US dollar today at 154.20, with a stop-loss at 154.05 and a target of 153.80. 153.60
EUR/USD
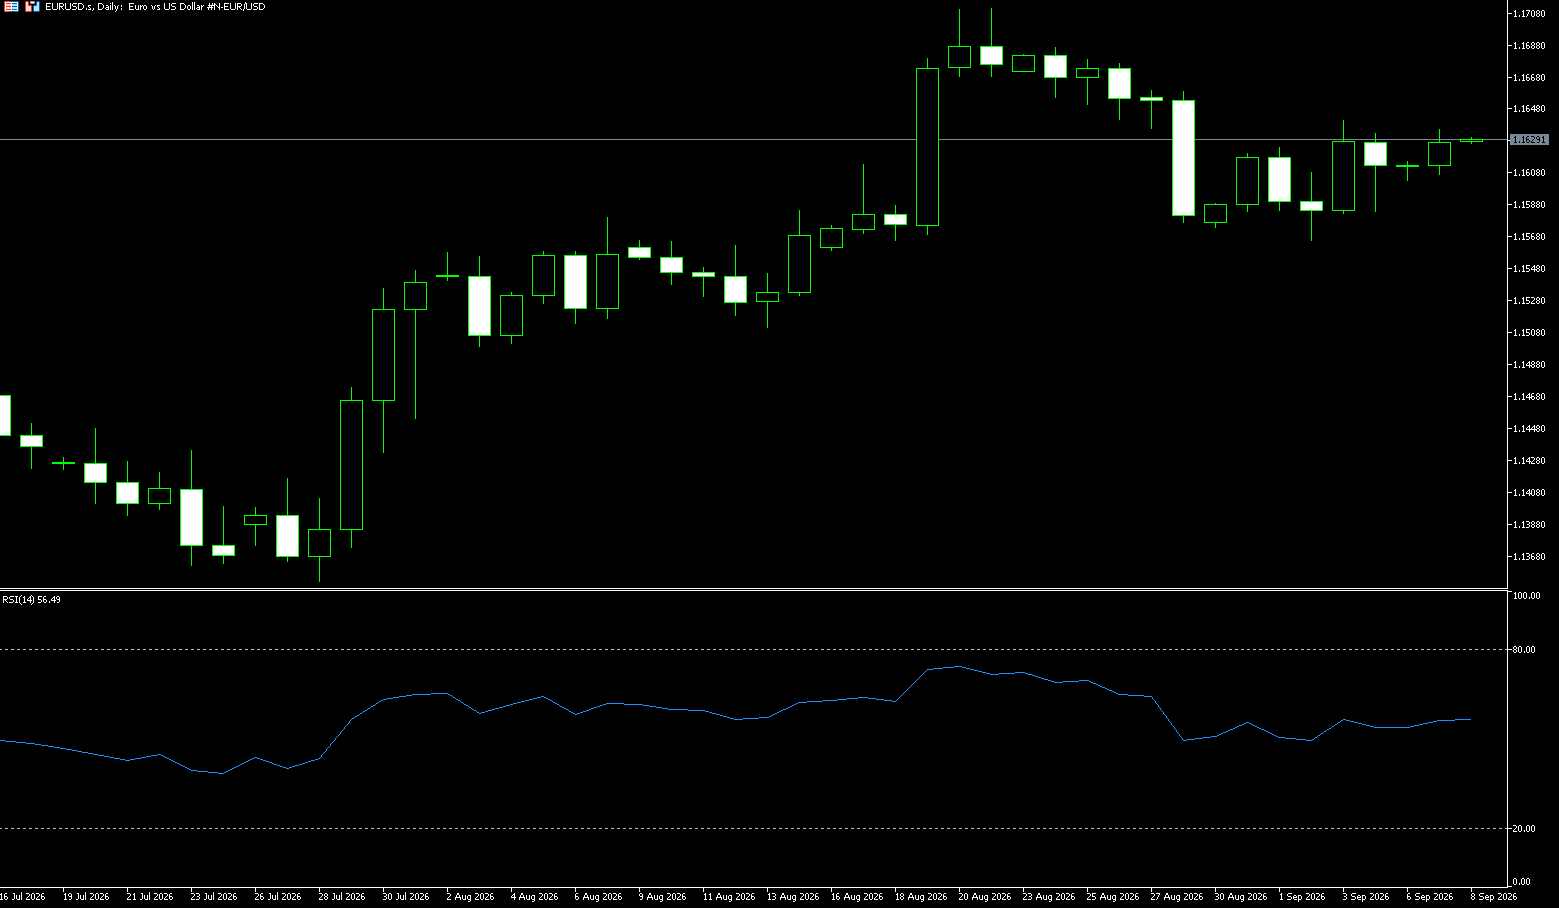
The euro was flat against the dollar on Monday, hovering above 1.1610 at the start of the European session, continuing its decline from the 1.1640 area last week. German industrial production data offered little support, while rising oil prices driven by tensions in the Middle East added further pressure to the euro. However, the dollar's rebound has been limited so far due to the US market being closed for a bank holiday. German data showed that industrial production fell 1.1% month-on-month in July, compared to market expectations of 0.3% growth. June's figure was also revised down to 0% from the previously estimated 0.2% growth. On an annualized basis, German factory output fell further to 1.6%, compared to -0.5% in June. In the Eurozone, the focus this week is on the European Central Bank's monetary policy decision to be announced on Thursday. It is almost certain that the bank will raise its benchmark interest rate to 2.25%, but investors will be watching ECB President Christine Lagarde's speech for clues about another rate hike before the end of the year.
On the daily chart, the euro is trading at 1.1620 against the dollar, maintaining a slightly bullish short-term tone as it holds above the 100-day simple moving average at 1.1562. The Relative Strength Index (RSI) is around 54, still in neutral territory, suggesting continued downward pressure, but neither side shows strong signs of momentum exhaustion. On the upside, key resistance is the August high of 1.1679, followed by the August 21 high of 1.1711. On the downside, the 100-day simple moving average at 1.1562 is the first major support level that bulls need to hold to avoid further downside exposure. A break below the 100-day simple moving average could see the psychological level of 1.1500 become a key buffer for the pair.
Consider going long on the euro at 1.1612 today. Stop loss: 1.1600; Target: 1.1670; 1.1660
Stock Analysis:
Australian ASX 200 Stock Index
Basic Market Overview:
The Australian Securities Exchange (ASX) 200 index closed at 9,011 points on Monday, little changed, with gains in non-energy mining, energy, and logistics stocks offsetting declines in technology, business services, and healthcare. Earlier strength faded as US stock index futures fell due to renewed tensions in the Middle East, with attacks between Washington and Tehran over the Strait of Hormuz and other areas occurring over the weekend. Meanwhile, Wall Street was closed on Monday for a holiday. Locally, job advertisements rose for the second consecutive month in August, driven by seasonal hiring ahead of Christmas. In China, a major trading partner, key data will be released this week, including August's Consumer Price Index (CPI), Producer Price Index (PPI), and trade data.
Energy stocks performed well, with Woodside rising 1.6% and St. Toth rising 1.7%. English Community surged nearly 15% after rejecting a takeover offer from Walburg Pincus that increased the developer's valuation by 30%. Technology stocks performed weakly, led by a 3.9% drop in Xero and a 3.8% drop in Wisetech, while two of the Big Four banks showed lackluster performance.
Sector Performance:
This Week's Sector Rotation
Sector Divergence {Monday's Market Overview}
Leading Gains: Energy (+1.78%) (driven by increases in coal and crude oil), Raw Materials (iron ore holding above $100), Industrials, and Financials all saw slight gains.
Leading Losers: Utilities, Healthcare, Consumer Staples, and Communication Services weakened, indicating significant market divergence and the disappearance of a broad-based rally.
Number of Advancing and Declining Stocks: Declining stocks outnumbered advancing stocks, with the index supported by resource-heavy stocks, resulting in a weak profit-making effect.
Technical Analysis:
The ASX200 opened higher at 9021 (approximately +0.2% higher than Friday's close of 9006). After an initial surge, bullish momentum quickly weakened, leading to a pullback throughout the day. It closed at 9010.9, a slight increase of 0.06%, exhibiting a high-opening, low-volume, consolidation pattern. The intraday range was approximately 8998-9022, indicating a very narrow fluctuation range. US stocks were closed on Monday, leaving a lack of external references; Middle East geopolitical tensions pushed up oil prices; the Australian dollar remained range-bound around 0.72; the market awaited China's August economic data, Australian inflation, and RBA interest rate hike expectations.
Tuesday's Technical Outlook: Tuesday is expected to see narrow-range trading, awaiting a directional breakout. A trend breakout requires support from trading volume and external commodity markets. Three Scenario Analysis: **Strong Scenario (Stabilizing above 9010):** Commodities remain strong, with resource stocks continuing to support the index; a break above 9060 with increased volume could challenge the 9080-9100 range. **Neutral Scenario (8995-9060 Range):** The most likely scenario, with bulls and bears battling it out, fluctuating between the 50-day and 20-day moving averages, resulting in narrowing volatility. **Weak Scenario (A Break Below 8995):** A break below the 50-day moving average with increased volume indicates short-term weakness, with a test of the 8930-8950 support zone.
Trading Strategies (Short-Term Perspective)
Short-Term Trading Strategies (Intraday/1-2 Trading Days Perspective)
1. Bullish Strategy
• If a pullback to 8995-9000 stabilizes and forms a bullish candlestick, consider a small long position; place a stop-loss below 8980; first target 9055-9060, break above to 9090.
• Only after a strong break above 9060 with significant volume can you add to your long position; otherwise, take short-term profits.
2. Bearish Strategy
• If a rebound to 9055-9060 encounters resistance and falls back, consider a short position; place a stop-loss above 9070; downside target 8995, break below to 8940.
Key Risk Warnings:
1. Commodity Risk: Significant fluctuations in iron ore and crude oil prices directly impact energy and mining stocks, rapidly causing index jumps and falls.
2. External Data Risks: This week's Chinese CPI and PPI data, US Treasury yields, and dollar fluctuations will alter market risk appetite.
3. Geopolitical Risks: Sudden changes in the Middle East situation could push up oil prices and risk aversion, leading to sudden price gaps.
4. Monetary Policy Risks: Australian employment and inflation data could raise expectations of an RBA rate hike, suppressing stock market valuations.
Japan Stock Market Index (JP225)
Basic Market Overview:
The Nikkei 225 rose 2.12% to close at 66,400 points, while the broader Topix index rose 0.55% to close at 4,126 points. Japanese stocks rose for the second consecutive trading day on Monday, with technology stocks rebounding on optimism surrounding a new OpenAI model that could boost demand for AI computing power. Local technology stocks also followed gains in US chipmakers and memory stocks, although the broader market was pressured by stronger-than-expected US employment data, which increased expectations of a Fed rate hike this month. Investors also continue to expect a rate hike by the Bank of Japan at its September meeting, as persistent inflation and a weak yen remain major concerns.
Leading technology stocks included Kioxia Holdings (up 9.3%), SoftBank Group (up 11.2%), Advantest (up 4.2%), Taiyo Electronics (up 4.2%), and Ibiden (up 8.4%). Meanwhile, financial and consumer stocks underperformed, with Mitsubishi UFJ (down 2%) and Nintendo (down 1%) among the decliners.
Sector Performance:
Leading Sectors: Semiconductors, AI Technology. SoftBank Group (+11.2%), Kioxia (+9.3%), Ibiden (+8.4%), Advantest, and Tokyo Electron saw significant gains, acting as the core drivers of the index.
Leading Sectors: Banking & Financials, Consumer Discretionary. Mitsubishi UFJ Financials declined, and Nintendo weakened, indicating a shift in funds from low-growth value sectors to technology growth stocks, resulting in significant sector divergence.
Technical Analysis:
The Nikkei 225 opened at 65,600.42, with an intraday low equal to the opening price, a high of 66,668.71, and a closing price of 66,399.84, a daily gain of +1,378.90 points (+2.12%). It opened higher and continued its upward trend throughout the day, without any pullback to fill the gap from the opening. Market Structure: Overnight strength in US semiconductor stocks, coupled with the catalyst of OpenAI's new AI model, led to a direct gap up at the open. Funds poured into the AI/memory chip sector, driving continuous buying. A slight pullback occurred in the afternoon, but the closing price retained most of the gains, forming a large bullish candlestick. Technical Indicators: The price has risen above the short-term moving average, indicating a recovery in rebound momentum; the RSI is rising but has not yet entered severely overbought territory; the MACD histogram has disappeared and the red histogram is expanding, indicating a significant recovery in short-term bullish momentum. Gaps: The market opened higher this morning, creating an upward gap. 65,600 will become strong support for the day.
Tuesday Technical Outlook: Two Scenario Analysis: Stronger Scenario (Base Expectation): If US tech stocks remain relatively stable overnight and the yen does not appreciate rapidly, the market will likely test the 66,600-66,900 resistance level in the morning. If it fails to break through with significant volume, it will likely enter a period of high-level consolidation to digest profit-taking, fluctuating within the 66,000-66,700 range. Pullback Scenario: Profit-taking will occur, causing a pullback to test the 66,000 support level. Once the market effectively breaks below 66,000 and the 65,600 gap, the rebound will be considered over, and the market will return to a pullback trend.
Tuesday Technical Outlook: Two Scenario Analysis: Stronger Scenario: If US tech stocks remain relatively stable overnight and the yen does not appreciate rapidly, the market will likely test the 66,000-66,900 resistance level in the morning. If the market effectively breaks below 66,000 and the 65,600 gap, the rebound will be considered over, and the market will return to a pullback trend. Trading Strategy:
Operational Strategy (Short-Term Perspective)
Bull Strategy:
If the price retraces to around 66,000 and stabilizes with reduced volume and no new lows, consider a small long position; place a stop-loss below 65,550; the first target is 66,650, with a further target of 67,200 if it breaks through. Avoid chasing the market higher above 66,700 at the open to prevent buying at short-term resistance levels.
Bear Strategy:
If the price breaks into the 66,700-66,900 range with increased volume and then stagnates, consider a small short position; place a stop-loss above 67,000; the first downside target is 66,000, with a further target of 65,600 if it breaks through.
Key Risk Warnings:
1. External Risks from US Stocks and Treasuries: The overnight pullback in the US semiconductor sector and rising US Treasury yields will directly suppress the opening sentiment of Japanese stocks; US employment data will cause fluctuations in expectations regarding Federal Reserve policy. 2. Yen Exchange Rate Volatility: A rapid appreciation of the yen is negative for Japanese exports and technology stocks, potentially triggering a sharp drop in the index; the expectation of a September rate hike by the Bank of Japan continues to disrupt market sentiment.
3. Profit-Taking Pressure: Monday's surge of over 2% has resulted in substantial short-term floating profits, making Tuesday a potential day for concentrated profit-taking and significant volatility.
4. News Impact: AI industry news, geopolitical risks, and speeches by Bank of Japan officials could all disrupt short-term technical ranges.
Disclaimer: The information contained herein (1) is proprietary to BCR and/or its content providers; (2) may not be copied or distributed; (3) is not warranted to be accurate, complete or timely; and, (4) does not constitute advice or a recommendation by BCR or its content providers in respect of the investment in financial instruments. Neither BCR or its content providers are responsible for any damages or losses arising from any use of this information. Past performance is no guarantee of future results.
Lebih Liputan






2026 © - All Rights Reserved by BCR Co Pty Ltd
Pendedahan Risiko:Instrumen derivatif diniagakan di luar bursa dengan margin, yang bermakna ia membawa tahap risiko yang tinggi dan terdapat kemungkinan anda boleh kehilangan seluruh pelaburan anda. Produk-produk ini tidak sesuai untuk semua pelabur. Pastikan anda memahami sepenuhnya risiko dan pertimbangkan dengan teliti keadaan kewangan dan pengalaman dagangan anda sebelum berdagang. Cari nasihat kewangan bebas jika perlu sebelum membuka akaun dengan BCR.
BCR Co Pty Ltd (No. Syarikat 1975046) ialah syarikat yang diperbadankan di bawah undang-undang British Virgin Islands, dengan pejabat berdaftar di Trident Chambers, Wickham’s Cay 1, Road Town, Tortola, British Virgin Islands, dan dilesenkan serta dikawal selia oleh Suruhanjaya Perkhidmatan Kewangan British Virgin Islands di bawah Lesen No. SIBA/L/19/1122.
Open Bridge Limited (No. Syarikat 16701394) ialah syarikat yang diperbadankan di bawah Akta Syarikat 2006 dan berdaftar di England dan Wales, dengan alamat berdaftar di Kemp House, 160 City Road, London, England, EC1V 2NX. Open Bridge Limited bertindak semata-mata sebagai pemproses pembayaran untuk BCR Co Pty Ltd dan tidak menyediakan sebarang perkhidmatan kewangan, perdagangan atau pelaburan bagi pihaknya. Peranan Open Bridge Limited adalah terhad kepada pemprosesan pembayaran.


 English
 简体中文
简体中文
 繁體中文
繁體中文
 Bahasa
Melayu
Bahasa
Melayu
 Tiếng
Việt
Tiếng
Việt
 ไทย
ไทย
 日本語
日本語
 한국어
한국어
 ភាសាខ្មែរ
 español