0
Currency & Commodity Analysis:
US Dollar Index
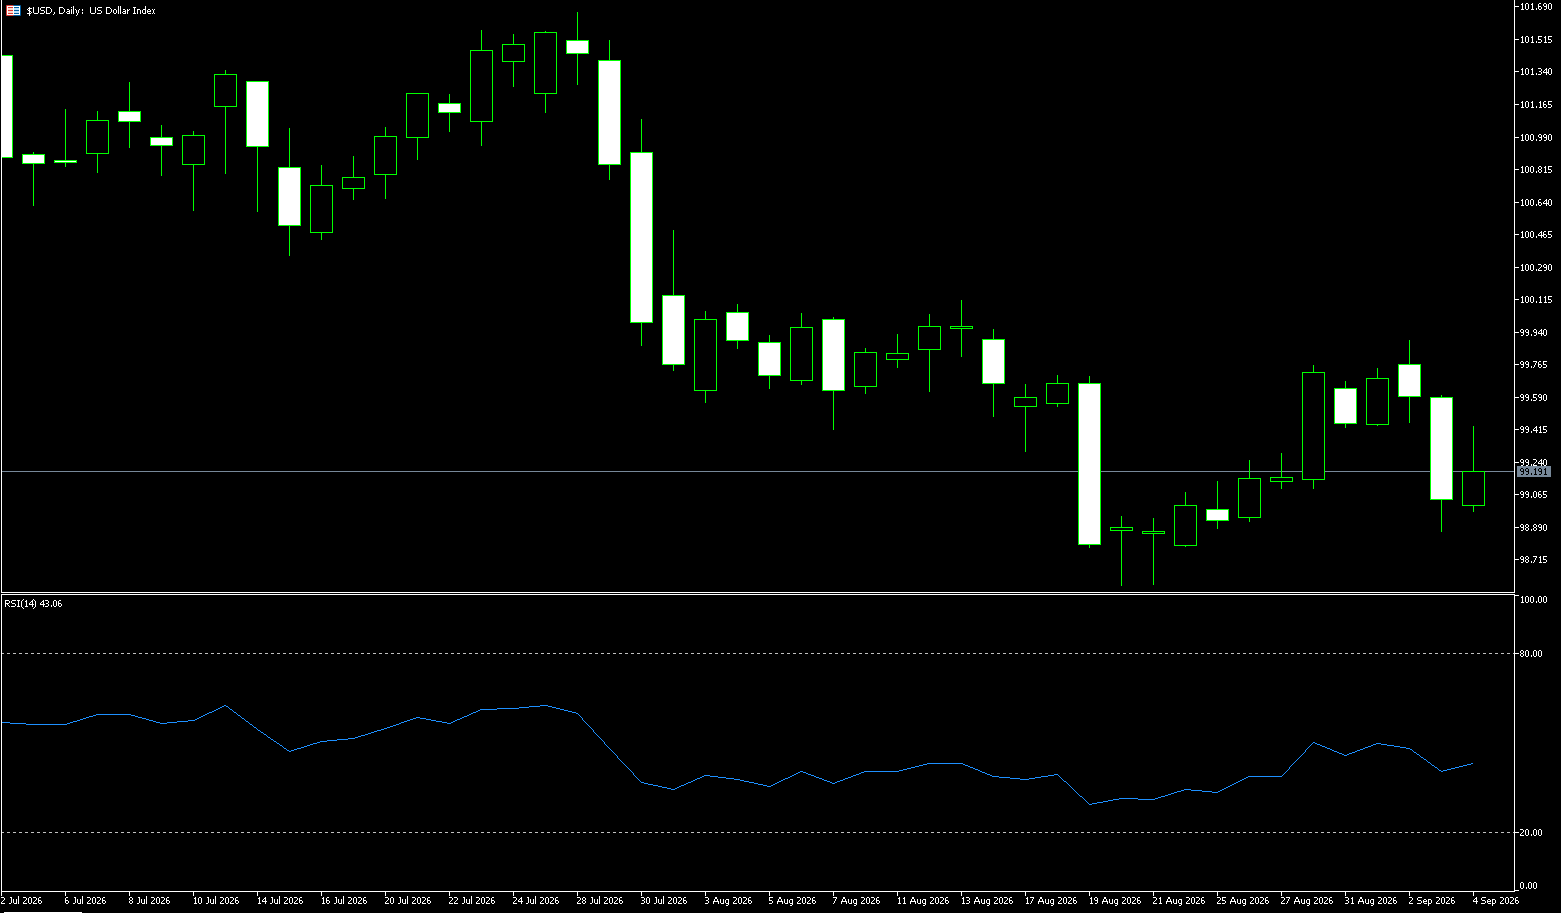
Last week, the US dollar index briefly fell below 99.00 to a two-week low of 98.83, as traders lowered their expectations for a rate hike this month after dovish comments from Federal Reserve officials. Federal Reserve Governor Christopher Waller stated that he would support maintaining interest rates if price pressures continue to ease, adding that his next policy decision will heavily depend on the August inflation data to be released next week. Traders now estimate a roughly 50% probability of a September rate hike, down from around 63% the previous day. The dollar is also facing pressure from a surging yen as traders focus on signs of intervention and assess the prospect of a more aggressive policy tightening by the Bank of Japan this year. The dollar index is expected to decline by about 0.7% this week.
The dollar is not entirely without the conditions for a rebound. US inflation data remains relatively high, and if the job market shows renewed resilience, market expectations for the Federal Reserve to maintain high interest rates or even further tighten policy this year may resurface. Furthermore, global risk aversion and the US economy's growth advantage relative to other major economies could also provide support for the dollar at key junctures. Therefore, the dollar market will enter a data-driven phase in the short term. Especially with the probability of a September rate hike now around 50%, any unexpected data could cause a rapid readjustment of interest rate pricing and amplify intraday volatility in the dollar index.
Last week, the price traded between 98.80 and 99.83. Initially, it tested resistance near 99.80, but then retreated due to dovish comments from Fed officials and weaker-than-expected ADP employment data, experiencing a three-day decline and gradually shifting the center of gravity downwards, closing near the 99 level and consolidating. The overall pattern last week was a weak, oscillating candlestick with an upper shadow, indicating a pullback after a rebound encountered resistance. The index was pressured below short-term moving averages, while medium-term moving averages flattened and leaned bearish. The RSI fell from above 50 to a neutral-to-weak range, not yet reaching deep oversold territory; the Bollinger Bands midline at 99.37 formed a strong resistance zone. The medium-to-long-term structure maintains a downward oscillating pattern from high levels, with the 100 level now acting as significant resistance. The weekly RSI remained neutral, showing no clear unilateral trend signal.
From a daily chart perspective, the US dollar index is currently trading around 99.00, with the short-term bearish trend still dominating. The index continues to trade below its 20-day and 200-day exponential moving averages, currently around 99.37 and 99.14 respectively, significantly suppressing any potential dollar rebound. The 14-day RSI is near 40 and below the 50 midline, indicating that market momentum remains bearish; however, the indicator has not yet entered severely oversold territory, suggesting further downside potential for the dollar. In the short term, the first resistance level to watch is the 20-day exponential moving average around 99.37. If the index re-establishes itself above this level, it may continue to test the 99.86 (this week's high) and 100.00 (a psychological level). If it breaks through the 99.00 (psychological level) and 98.83 (last week's low), further observation is needed at 98.56 (last month's low). A break below this level would target the support around 98.26 (the low of May 13th). Only a re-establishment above the 200-day exponential moving average could significantly alleviate the short-term bearish structure.
Today, consider shorting the US Dollar Index at 99.26, with a stop-loss at 99.38 and targets at 98.80 and 98.70.
WTI Crude Oil
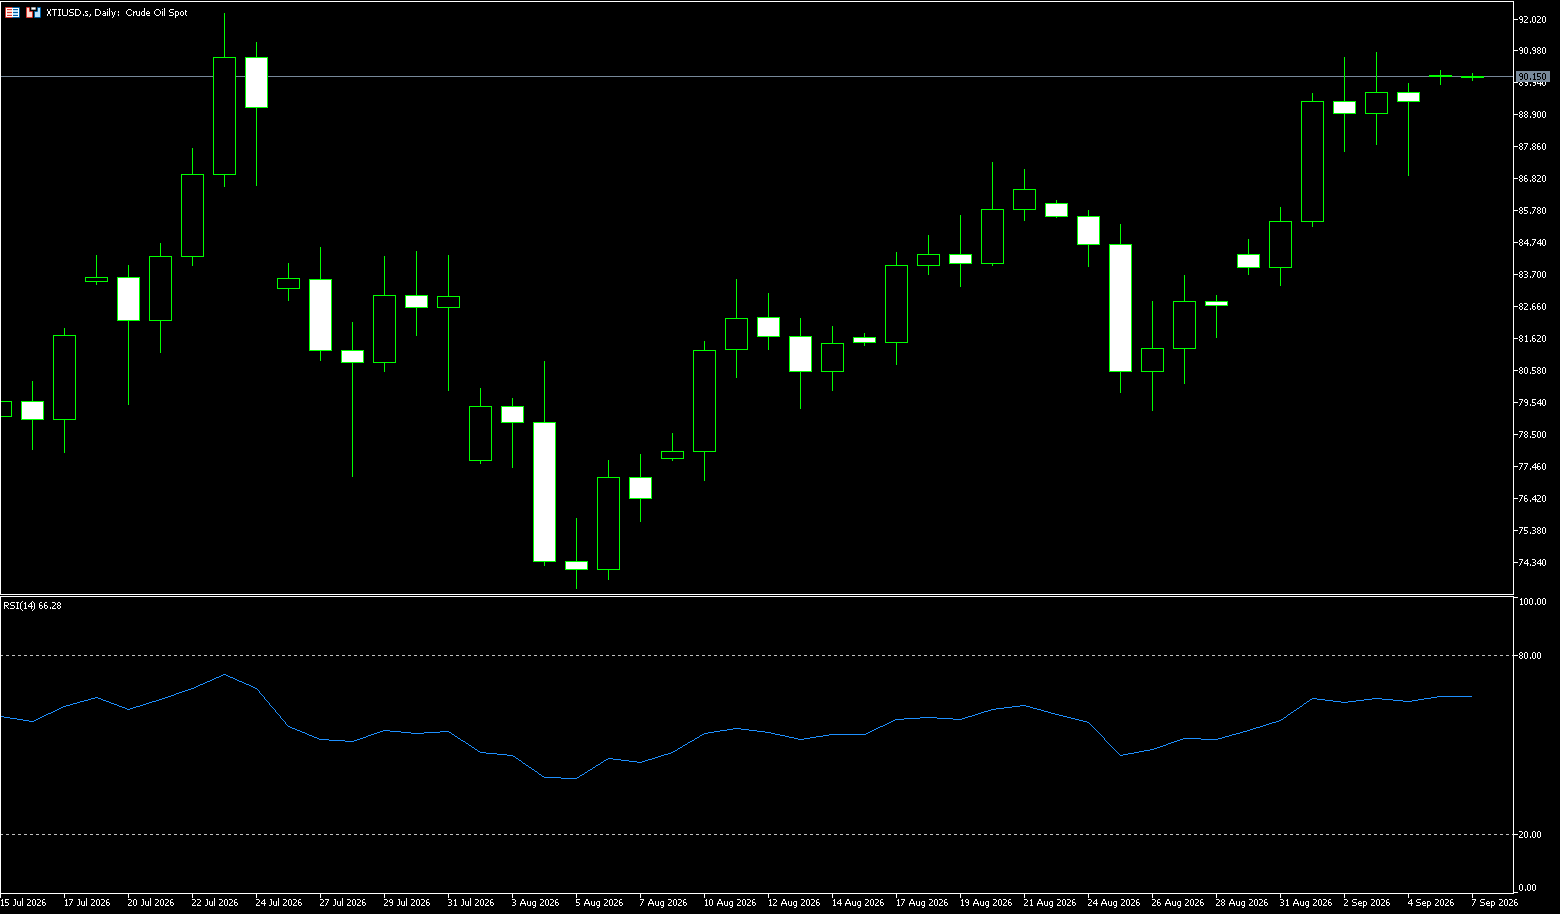
On Friday, crude oil traded around $89.30 per barrel, up more than 7% for the week, marking its strongest weekly performance since mid-July, as the Middle East war continued and the prospects for peace remained bleak. Iran and the United States exchanged missile strikes this week, while the Israeli defense minister threatened “devastating” attacks on Iranian infrastructure, including energy facilities. Meanwhile, US Vice President JD Vance stated that the US planned not to hold peace talks with Iran until it stopped attacking ships in the Strait of Hormuz, further increasing upward pressure on oil prices, as Iran expressed its determination to respond strongly to the latest US strikes.
The EU has formally joined the US-led sanctions against Iran, while South Korea indicated it is considering a military role. This rally could lose momentum if traffic in the Strait of Hormuz increases. Reports on Iraqi oil exports showed an average of 2.35 million barrels per day exported in August, mainly via the southern route. The current oil price has not fallen sharply despite easing transportation risks because the regional situation still presents a possibility of resurgence. Recent military actions have exacerbated market concerns about disruptions to crude oil supply, while new security risks have made it difficult for investors to fully withdraw from the risk premium in the energy market. Meanwhile, signals from Russia indicating a willingness to promote peace negotiations have provided some buffer to market sentiment, allowing some investors to reassess potential supply risks.
Last week, WTI crude oil initiated a bullish counterattack from its lows, opening around $83 and trading near $89 per barrel. Although the bullish momentum did not accelerate sustainably, the overall trend remains strong. Current market momentum is significantly strengthened by geopolitical events, meaning technical movements are easily influenced by unexpected news. The first resistance level to watch is the $92.25 (July high) – $94.86 (June high) area. A successful break and hold above this level could open up further potential towards the psychological level of $100, which was previously the high. On the downside, key support is around $86.94 (Friday's low). A break below this level could lead to a pullback to $85.16 (100-day moving average) to find new buying support. If geopolitical risks ease further, technical downward pressure may gradually increase.
Consider going long on crude oil today at 89.15, with a stop loss at 89.00 and targets at 90.50 and 92.00.
Spot Gold
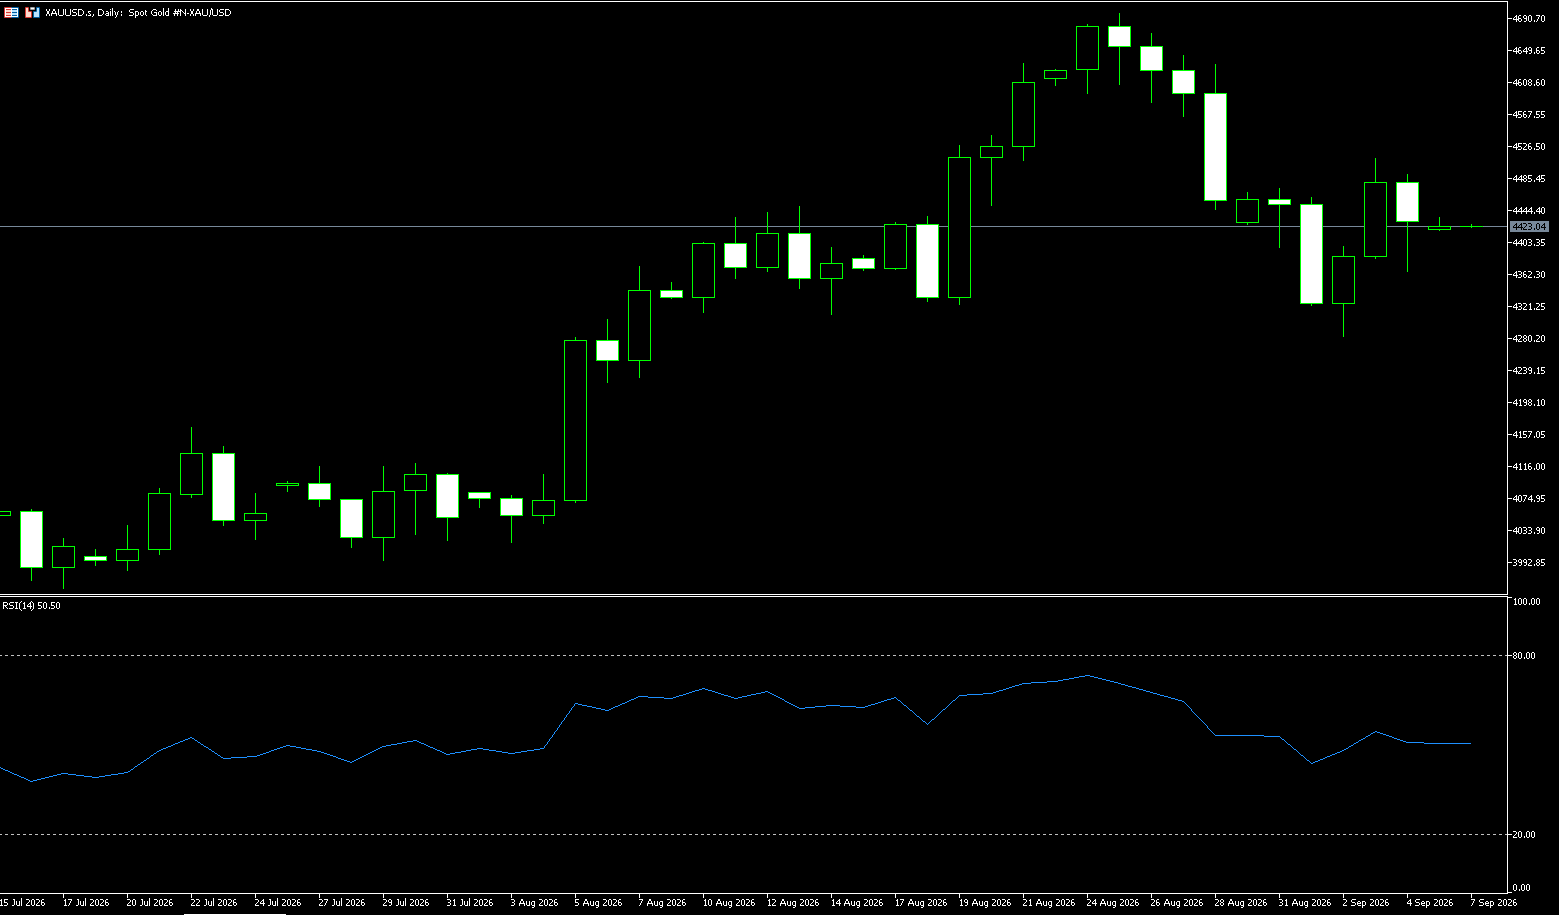
Gold prices were pressured over the weekend after stronger-than-expected US non-farm payroll data reignited market expectations for a Federal Reserve rate hike. Gold prices briefly fell to near an intraday low of $4,365, a drop of more than 2%, before rebounding as the dollar and Treasury yields lost momentum. At the close, gold/dollar traded around $4,430. After a sharp decline at the beginning of the week, spot gold successfully recovered all its losses, reflecting a shift in market pricing in a possible interest rate decision at the Fed's next meeting. Mid-week, gold prices rose more than 2%, briefly approaching a high of $4,510, as Waller's comments prompted the market to reduce expectations for a September Fed rate hike, thereby pressuring Treasury yields and the dollar. This latest move partially reversed the sharp sell-off earlier this week—when Walsh's speech in Jackson Hole and rising global yields pressured precious metals. Geopolitical tensions continue to provide marginal support for gold prices, although higher oil prices pose a two-way risk if they are reflected in inflation expectations and yields. Data released on Friday showed that US nonfarm payrolls increased by 162,000 in August. This figure far exceeded market expectations of 56,000, prompting a market reaction that pushed the dollar stronger. Other details in the report showed that total employment figures for June and July were revised upward by 11,000 and 44,000 respectively, while the unemployment rate remained unchanged at 4.1%. Gold failed to sustain its rebound after the strong labor market report, with gains stalling near the end of the week.
Last week, gold experienced a volatile correction, characterized by a sharp drop from its highs followed by a bottoming-out process. The previous high was set at $4,697 (a high reached at the end of August before retreating). At the beginning of the week, the price continued to decline, influenced by the hawkish sentiment from Jackson Hole. However, the significantly stronger-than-expected non-farm payroll data caused a rapid drop to around $4,365, before buying interest led to a slight recovery. The weekly chart closed with a long lower shadow bearish candlestick, indicating a sharp consolidation at high levels. From Monday to Thursday, the price remained under pressure, with moving averages turning downwards to form short-term resistance. The non-farm payroll data night resulted in a long lower shadow candlestick, indicating a bottoming-out move. The MACD formed a bearish crossover at a high level and is trending downwards, while the KDJ has entered a low range, suggesting a potential short-term rebound.
Technical Outlook for Next Week: The 14-day Relative Strength Index (RSI) on the daily chart successfully rebounded above the neutral line of 50 after falling below it at the beginning of the week, currently reading around 51.6. Furthermore, although it had previously closed below this level, gold has regained its position above the 100-day simple moving average. Currently, gold is trading at approximately $4,354. However, the daily RSI is still flat above 50, and the price has not yet broken decisively above the 200-day simple moving average (S) at approximately $4,534, indicating that buyers are still reluctant to bet on a stable upward trend. On the upside, the $4,472 (134-day simple moving average) – $4,500 (psychological level) form a key resistance zone. If the price can stabilize above this zone and confirm it as support, the 200-day simple moving average at $4,534 can be considered the next bullish target, followed by the $4,600 (psychological level). On the downside, the first significant support level is seen at approximately $4,354 (100-day simple moving average), followed by $4,365 (last Friday's low), and then $4,300 (static level).
Consider going long on gold today at $4,325, with a stop loss at $4,420 and targets of $4,480 and $4,500.
AUD/USD
The Australian dollar broke through US$0.72 before the end of last week, reaching a four-month high, supported by increased expectations of a near-term rate hike and a weaker US dollar. The US dollar came under pressure after Federal Reserve Governor Christopher Waller stated he would support keeping interest rates unchanged if inflationary pressures continued to ease, and investors reduced their bets on a Fed rate hike this month. In Australia, stronger second-quarter GDP data reinforced market expectations that the Reserve Bank of Australia might resume tightening policy after three rate hikes this year. The market now expects a 58% probability of a rate hike this month, up from 49% previously, while a November rate hike has been fully priced in. The swap market also suggests a 40 basis point tightening next year, equivalent to one and a half rate hikes.
Concerns about inflation have subsided. The Australian dollar is gaining upward momentum, supported by strong economic growth data, which has also increased market expectations for an imminent interest rate hike. The Australian economy showed unexpected resilience in the second quarter, further reinforcing the view that the Reserve Bank of Australia (RBA) may resume monetary tightening after three rate hikes earlier this year. Consequently, the market's probability of a rate hike this month has risen from 49% before the GDP data release to 58%, and a rate adjustment to 4.60% in November is already fully priced in.
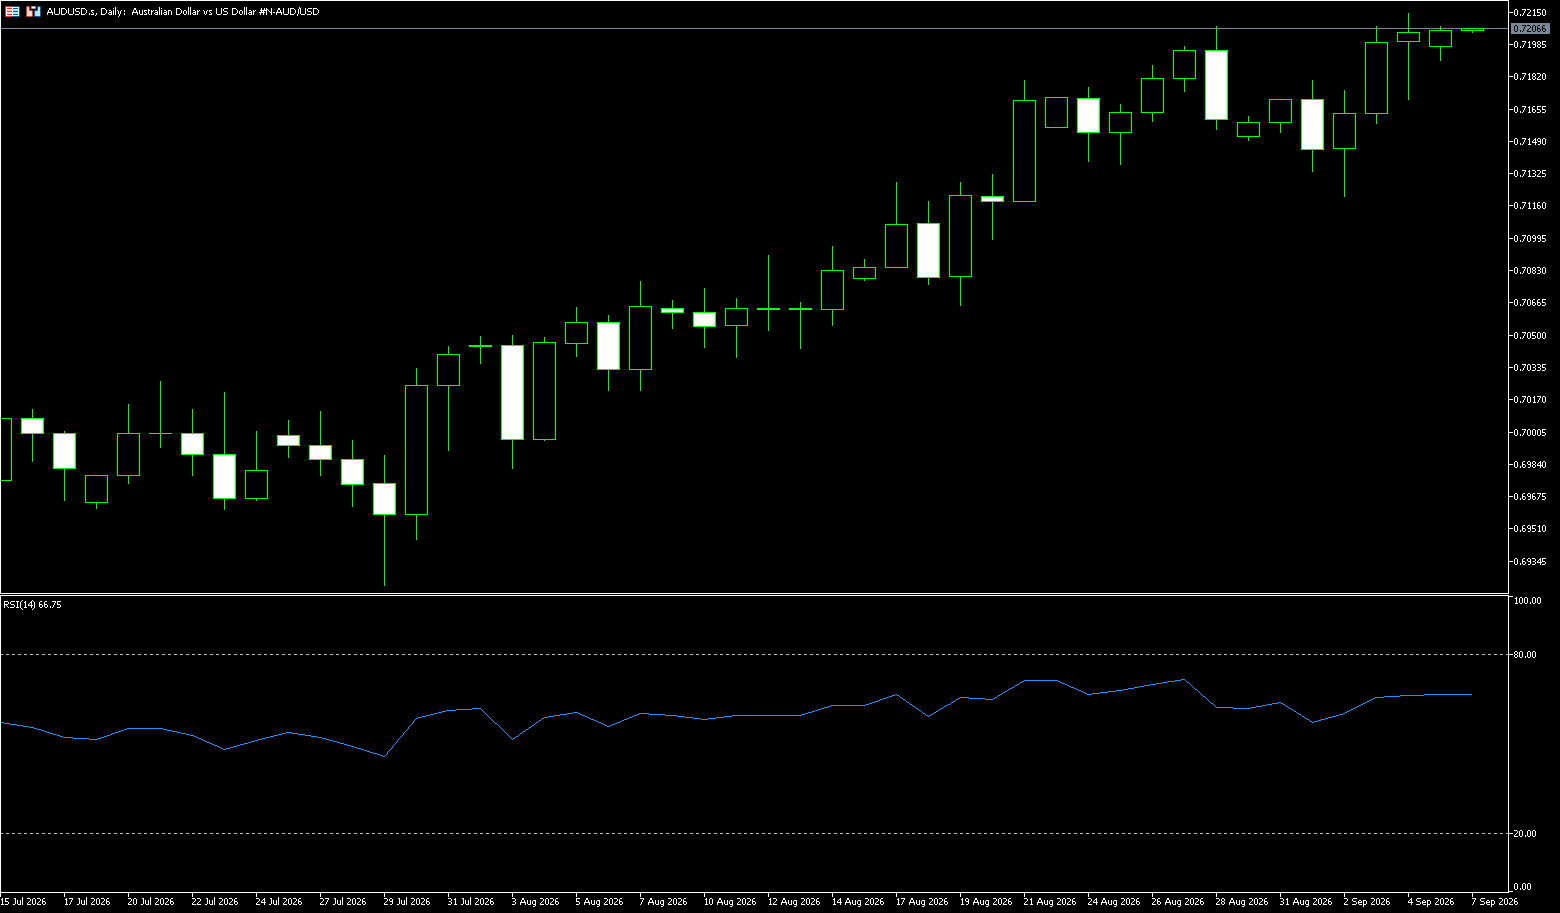
Last week, the AUD/USD pair traded in a pattern of initial upward movement, testing higher levels, and then consolidating near pre-nonfarm payroll levels. A weaker US dollar drove the pair to test the key 0.7200-0.7210 range, reaching a new high before consolidating at higher levels. Dovish comments from Federal Reserve officials lowered US Treasury yields, and stronger-than-expected Australian GDP data increased expectations of an RBA rate hike, both contributing to the rise in the Australian dollar. The market awaits Friday's US nonfarm payroll report as a short-term catalyst. All medium- and long-term moving averages (20/50/100/200 simple moving averages) are providing upward support for the price, and the medium-term bullish structure remains intact. The RSI has risen to the 65-70 range, indicating bullish dominance but approaching short-term overbought resistance. The increased upper shadows after the recent surge suggest selling pressure above.
Next week's technical outlook: US inflation, Fed officials' speeches, and US dollar index volatility; Australian officials' speeches will continue to influence expectations of an Australian interest rate hike, and data releases could easily cause sudden/false breakouts, amplifying the volatility of the AUD/USD pair. On the daily chart, the AUD/USD is trading around 0.7200, maintaining a constructive bullish tone as it holds above the 9-day (0.7175) and 20-day (0.7132) exponential moving averages (EMAs). The alignment of shorter-term EMAs above longer-term EMAs suggests a continued upward bias, while the 14-day Relative Strength Index (RSI) near 67 puts the pair in positive territory but hasn't yet signaled extreme overbought conditions, indicating that upward momentum remains intact. On the downside, initial support lies at the 9-day EMA around 0.7175, while the 20-day EMA is around 0.7132, providing deeper dynamic support should a corrective pullback occur. Further down, more distant horizontal support appears at the psychological level of 0.7100, which will only come into focus if the current bullish structure clearly breaks down. On the upside, watch for 0.7264 (the May 14 high), followed by the nearby upper limit of 0.7300 (a psychological resistance level).
Consider going long on the Australian dollar at 0.7190 today, with a stop loss at 0.7180 and targets at 0.7240 and 0.7250.
GBP/USD
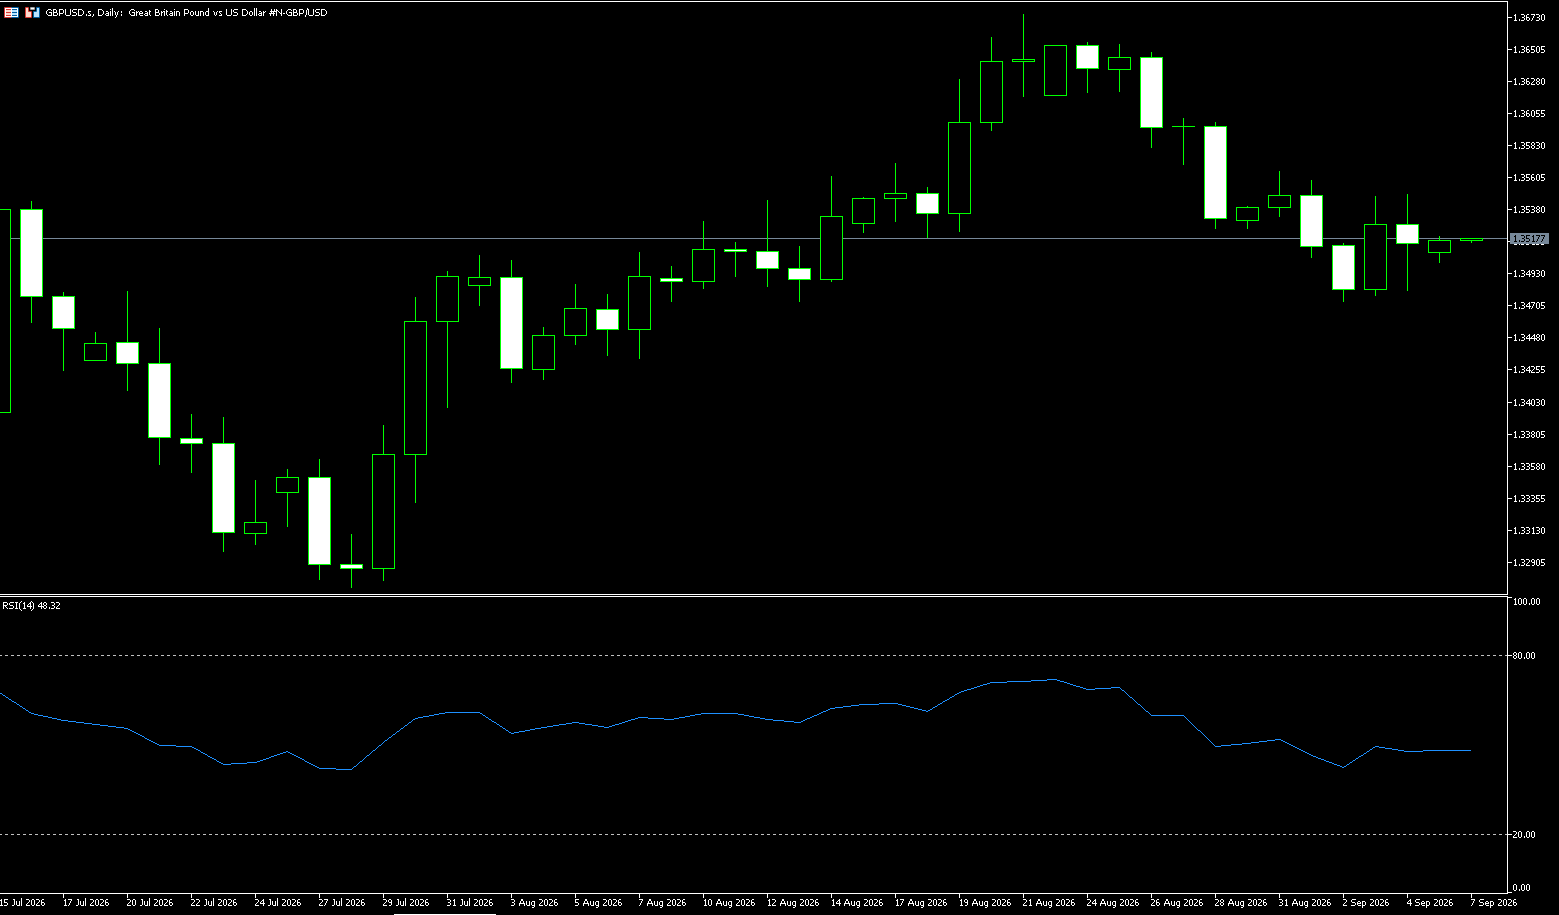
The pound continued its upward trend in the latter half of last week, breaking through $1.35 and rebounding from a two-week low. Investors awaited new guidance from the US employment data to be released later that day, while continuing to digest signals from major central banks. Bank of England Chief Economist Hugh Peele said last Thursday that raising interest rates now could reduce the risk of the central bank tightening policy more aggressively in the future to curb inflation, which has risen due to the impact of the Iran war. The market now fully expects the Bank of England to raise interest rates before the end of the year and anticipates another rate hike by March 2027.
Meanwhile, Federal Reserve Governor Christopher Waller said that recent data showed signs of inflation, and if upcoming data confirms this trend, he would prefer to keep interest rates unchanged at this month's policy meeting. Previously, the pound sterling rebounded sharply against major currency pairs after Bank of England Governing Council member Hugh Peele reiterated his call for raising the Bank of England's interest rate to 4% at a roundtable discussion at the Edinburgh Chamber of Commerce. He stated that raising rates beyond this level does not imply a prolonged period of aggressive rate hikes, adding that a rapid increase in rates could "prevent some potential implicit catch-up dynamics."
Last week, the pound sterling started the week lower against the dollar, falling from its highs and gradually declining from around 1.3620, briefly dipping to the key Fibonacci support level of 1.3470. Later in the week, driven by expectations of the non-farm payrolls report, it entered a narrow trading range of 1.3470-1.3550, with intensified competition between bulls and bears. The overall structure showed a short-term bearish correction with gradually lower highs, indicating a consolidation phase after the pullback from higher levels. Boosted by hawkish expectations from the Federal Reserve, the pound sterling broke below the short-term support levels of 1.3580 and 1.3520, putting the bears in control. The daily chart shows a continuous slight downward trend, with the MACD histogram contracting and signs of a potential death cross. The RSI has fallen back to near the neutral 50 level, indicating a balance between bulls and bears. The market has entered a consolidation phase, with 1.3470 serving as a key 50% Fibonacci support level for this pullback.
Next Week's Technical Outlook: Next week, the market will digest the non-farm payroll data, coupled with speeches from Bank of England and US officials. Volatility is likely to rise again. Two possible scenarios are: Scenario A (Bearish Baseline Scenario): If the non-farm payroll data is strong and the US dollar strengthens, the price will fail to hold above 1.3520. Scenario B (Rebound and Correction Scenario): If the non-farm payroll data is weak and the US dollar falls, the exchange rate will hold above the 1.3530-1.3560 range, confirmed by the daily close. GBP/USD is trading near the 200-day simple moving average at 1.3446 on the daily chart and above the 50.0% Fibonacci retracement level of the July-August rally. A clear break below this level would pave the way for deeper support at 1.3425 and 1.3357, where buyers are expected to defend the potential bullish structure. On the upside, initial resistance lies at the 23.6% Fibonacci retracement level of 1.3580, followed by the psychological level of 1.3600, with further resistance near the cycle high anchored at 1.3676.
Consider going long on GBP at 1.3508 today, with a stop-loss at 1.3500 and targets at 1.3550 and 1.3560.
USD/JPY
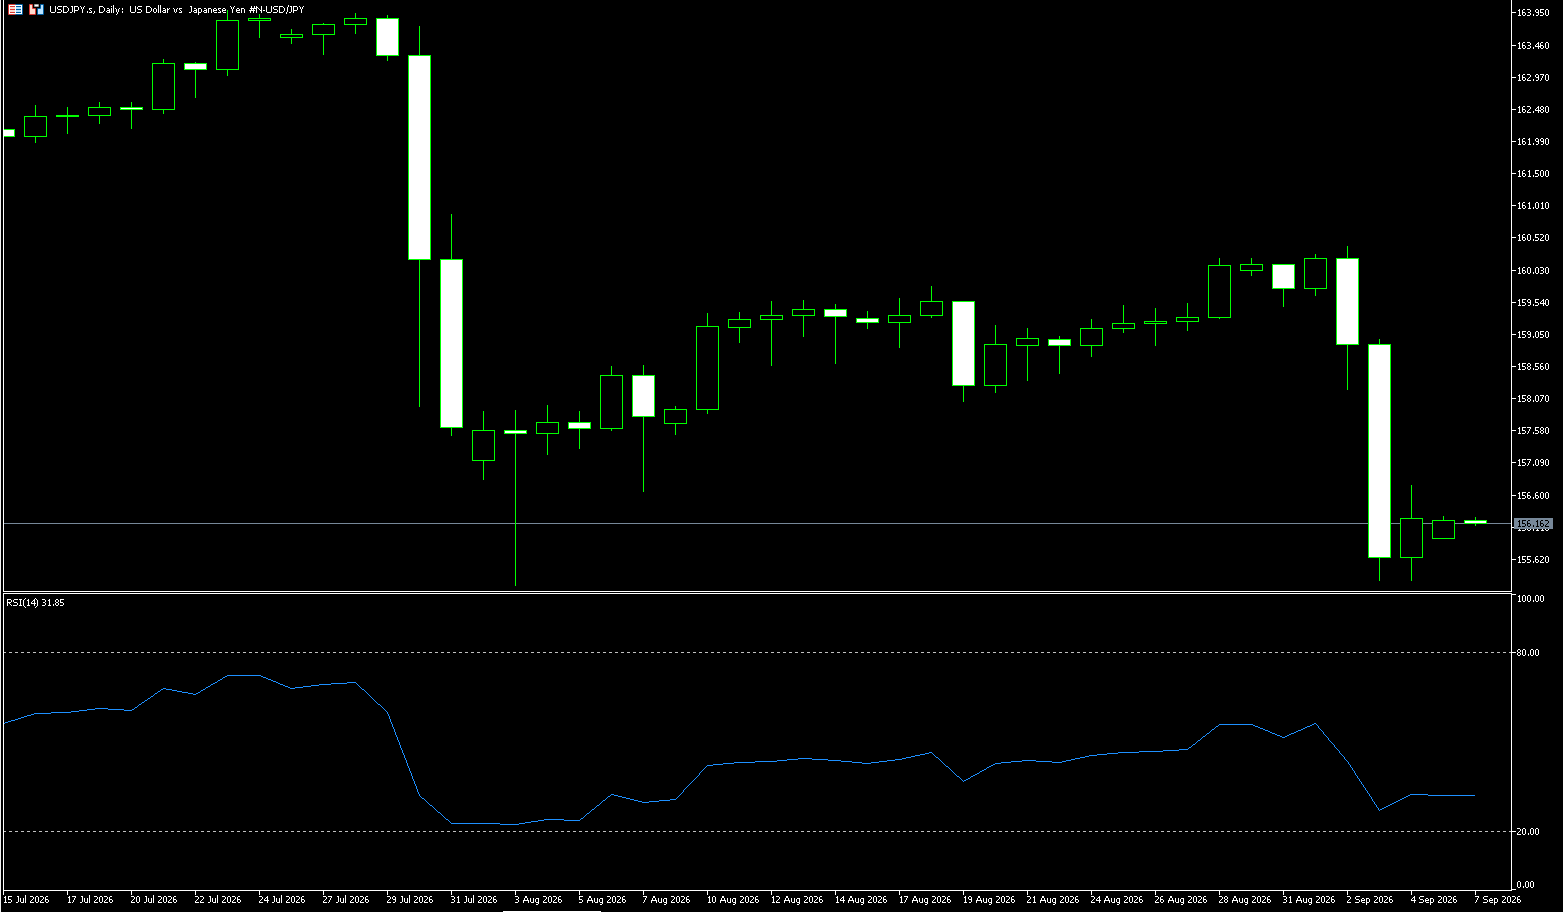
The yen technically rebounded to its lowest level since August in late trading last week, trading at 155.29 yen per dollar, putting it on track for a weekly gain of approximately 2.5%, its best performance since the joint currency-buying operation by Tokyo and Washington at the end of July. There is no confirmation yet that this week's rebound was driven by official intervention, although traders speculate that authorities conducted interest rate checks, which are often a precursor to intervention. The market is also weighing the prospect of more aggressive rate hikes by the Bank of Japan this year, following hawkish comments from central bank officials and increasing pressure from the US to support the yen through tighter monetary policy.
The Bank of Japan is expected to raise rates by 25 basis points this month, followed by another hike in December. Furthermore, the yen has benefited from a generally weaker dollar after Federal Reserve Governor Christopher Waller stated that he would support keeping interest rates unchanged if price pressures continue to ease. The yen has strengthened significantly in the past few trading days, causing USD/JPY to fall back to around 155.00. This level has proven to be a significant support level so far this year, having held after intervention-driven yen rallies in late April/early May and late July/early August. This latest sharp strengthening of the yen appears to be driven by fundamental factors rather than intervention, increasing the likelihood of a more sustained rebound.
At the beginning of last week, the exchange rate fluctuated around 160. However, pressured by hawkish signals from Bank of Japan officials indicating accelerated interest rate hikes and weak US employment data, the bulls failed to hold above 160, leading to a rapid decline in the latter half of the week. The price fell from above 160 to a low of 155.20-155.30, shifting the short-term trend from range-bound to bearish. The daily chart shows a rapid decline, with the RSI entering oversold territory, indicating rapid release of short-term bearish momentum. The 4-hour chart shows a decisive break below the medium-term moving average, forming a downward channel. The MACD histogram is widening, but a short-term oversold rebound is possible. The continued hawkish stance of Japanese officials has increased market pricing in a higher probability of a September Bank of Japan rate hike, directly determining the short-term strength of the US dollar. The Japanese Ministry of Finance continues to issue intervention warnings, keeping the market alert for potential intervention. (Sina Finance)
Technical Outlook for Next Week: The daily RSI is at a low level, and a slight technical rebound (bear market rally) cannot be ruled out. However, as long as the rebound fails to hold above 160, the overall structure remains bearish. If the pair holds above the 155.20-30 level (the August low and a key area of contention between bulls and bears), it will likely enter a low-level consolidation phase next week. A decisive break below 155.20-30 would open up further downside potential. A decisive break below 155.20-30 on the daily chart suggests that the recent correction may develop further, with the price potentially testing the 155.00 level. If this level also fails to hold, the downside could extend to the 153.99 (February 23 low) and 154.00 (psychological level). Conversely, if significant buying pressure forms around 155.20-30 and drives the exchange rate back up, then the 156.90 level (lower Bollinger Band) needs to be watched. A break below this level would target 158.18 (5-day moving average). The previously breached area has now become support.
Today, consider shorting the US dollar at 156.50, with a stop loss at 156.70 and targets at 155.80 and 155.50.
EUR/USD
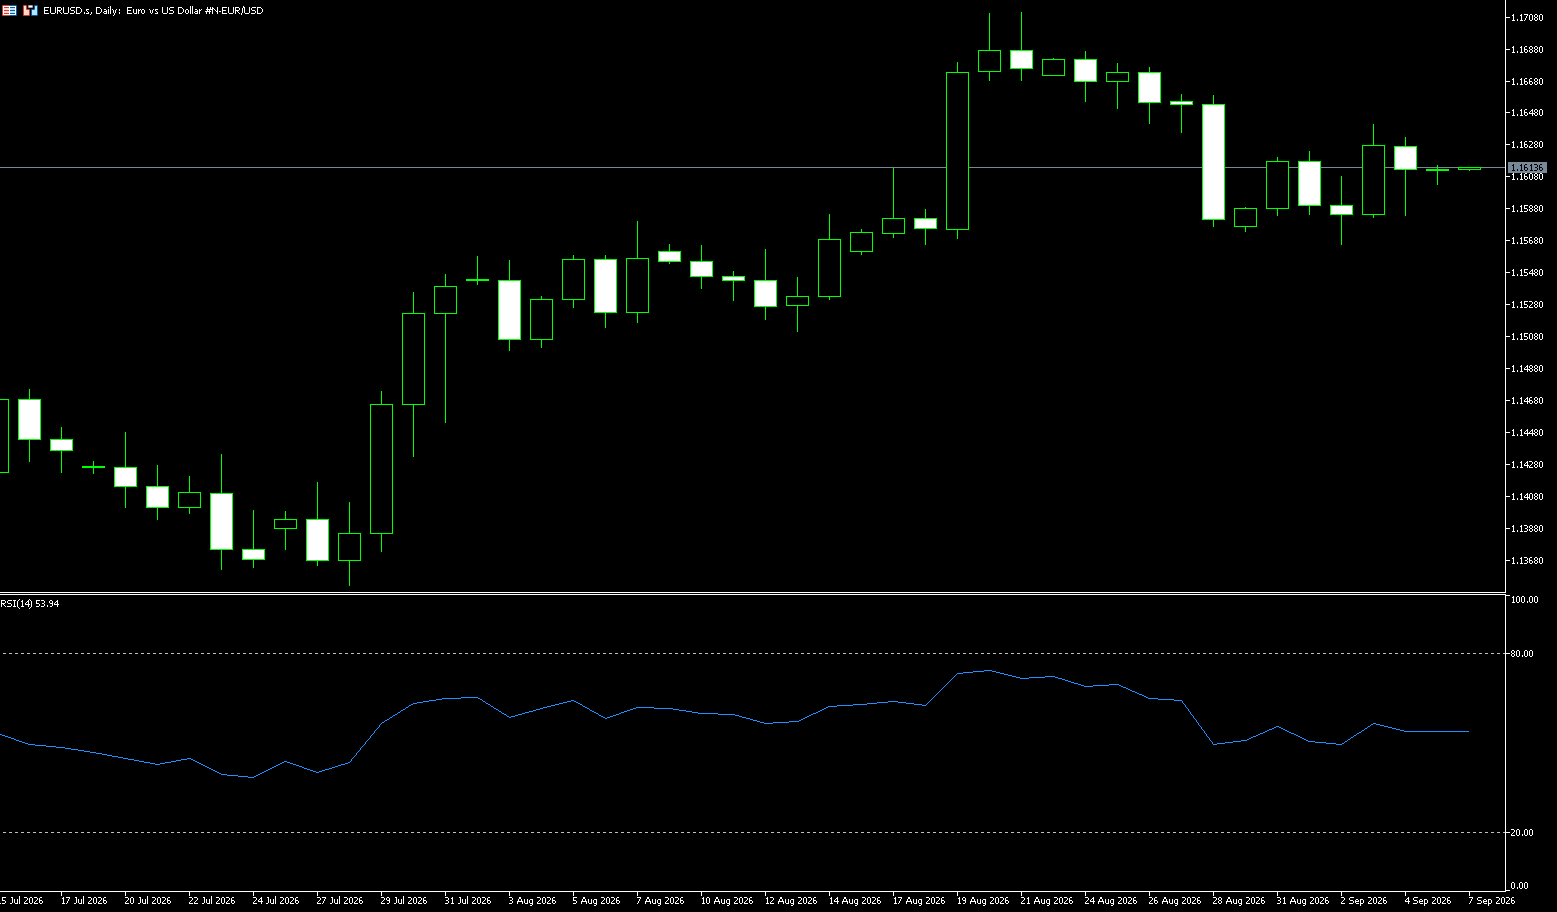
The euro/dollar pair rebounded above 1.16 in late last week, with investor attention shifting to the European Central Bank's meeting on September 10th. The money market continues to fully price in a 25 basis point rate hike to 2.5% by the ECB next week, while almost 100% expecting deposit rates to reach 3% by June 2027, implying two more rate hikes by mid-2027. On the economic data front, German factory orders rose 2.5% in July, lower than the revised 3.7% increase in June, but far exceeding market expectations of a 0.3% increase.
Eurozone retail sales fell 0.6% month-on-month in July, below market expectations of a 0.3% increase, while June's figure was revised from a previously estimated decline of 0.3% to an increase of 0.2%. On an annualized basis, retail spending rose 0.6% in July, just slightly above half of the market expectation of 1.1%. A more crucial factor was inflation, as some strong performance in the NFP (National Financial Policy Committee) could be seen as a reversal of July's weakness. In this sense, a strong jobs report would provide slight support for the dollar, but unless strong inflation data follows, it is unlikely to prompt the committee to shift towards raising interest rates. Meanwhile, the dollar continued to be pressured after dovish comments from Federal Reserve Governor Christopher Waller, who stated that recent data showed signs of weakening inflation, and if upcoming data confirms this trend, he would support keeping interest rates unchanged at this month's policy meeting.
Last week, the euro/dollar pair encountered resistance after an initial surge, testing support and maintaining an overall trading range of 1.1570-1.1640. At the beginning of the week, bulls attempted an upward move but encountered selling pressure at 1.1640-1.1650 (the 200-day moving average resistance zone) and failed to break through. In the latter half of the week, a slight rebound occurred driven by dovish comments from Fed officials, returning to consolidate above 1.1600. Overall, the week saw narrowing volatility, indicating a high-level consolidation and shakeout. The weekly candlestick is likely to close as a doji/small bearish doji, suggesting a weak directional signal. The euro/dollar pair is facing resistance below the 200-day moving average at 1.1634, with the 100-day moving average at 1.1564 forming a support level. The RSI has fallen from a high level to the neutral zone, showing a consolidation pattern.
Next week's technical outlook: Next week is a major data week: US CPI and the ECB interest rate decision will determine whether the trading range is broken. Prioritize assessing the breakout scenario. On the daily chart, the EUR/USD pair is consolidating near its opening level, holding above the 100-day simple moving average at 1.1564, indicating a slight advantage for potential buyers, but remaining below the Bollinger Band midline. The 14-day Relative Strength Index (RSI) is at 55.80, in neutral territory, suggesting balanced short-term momentum; it could either continue its upward trend slightly or consolidate further around current levels. On the upside, initial resistance is at 1.1634 (the 200-day simple moving average), with stronger resistance near the psychological level of 1.170 and the 1.1710 area (the August 20 high). On the downside, immediate support is defined by the 100-day simple moving average at 1.1564, with deeper support at the psychological level of around 1.1500, where buying interest is expected to increase if the pair continues its pullback.
Today, consider going long on the Euro at 1.1608, with a stop-loss at 1.1600 and targets at 1.1650 and 1.1660.
Stock Analysis:
Australian ASX 200 Stock Index
Basic Market Overview:
The Australian Securities Exchange (ASX) 200 index fell 14 points, or 0.2%, to close at 9006 on Friday, reversing modest gains in the morning and ending the week with a nearly 1% decline. Stronger-than-expected second-quarter GDP data reignited market concerns about another interest rate hike by the Reserve Bank of Australia later this month. Market sentiment was cautious ahead of key Chinese data next week, particularly August's Consumer Price Index (CPI) and Producer Price Index (PPI), as well as trade performance. Meanwhile, traders were nervous ahead of the US jobs report. Losses in the energy mining, utilities, and industrial sectors weighed on the market, although strong performance in non-energy mining, technology, and healthcare helped limit the decline.
Energy stocks were weak, with Ampol down 5.5%, Woodside down 1.4%, and Santos down 0.7%. Heavyweight companies BHP Group fell 2.2%, Computershare fell 2.9%, PLS fell 2.3%, and Xero fell 1.7%. In contrast, financial stocks provided support, with the four major banks rising slightly, and some technology stocks also rising, including Wisetech Global (up 3.1%). The four major bank stocks rose, and heavyweight BHP rose 0.9%. The market rose 0.4% this week, marking its first gain in three weeks.
Sector Performance:
This Week's Sector Rotation
Leading Sectors: Energy, Materials. Stronger international oil prices and commodities drove a rebound in coal, lithium, and mining stocks, becoming the main force supporting the index this week.
Leading Sectors: Consumer Discretionary, Consumer Staples, Telecommunication Services. Rising Treasury yields suppressed interest rate-sensitive consumer sectors, and ex-rights stocks further dragged down sector performance, with funds shifting from growth consumer stocks to resource defensive rotations.
Strong Stocks: Resource stocks such as Liontown Resources and Stanmore Resources; Weak Stocks: Retail and media stocks saw significant pullbacks.
Technical Analysis:
The ASX200 stock index experienced a high-level, low-volume consolidation and decline last week, entering a pullback phase after reaching its previous historical high of 9296.7. The index closed slightly lower for the week, with its center of gravity slowly shifting downwards, trading within a range of approximately 8990-9122, closing near 9006 on Friday. The market exhibited characteristics of upward pressure and weak rebounds, with multiple intraday attempts to break higher followed by weakness at the close, indicating a consolidation phase at the highs of a bull market. The price broke below the 20-day moving average (≈9081), shifting from a strong to a weak short-term trend; holding above the 50-day moving average (≈8992) serves as a crucial support level for the medium-term bullish trend. The RSI has fallen from overbought levels to the neutral zone (45-50), and the MACD histogram is contracting, indicating weakening upward momentum without a clear bearish divergence. Overall trading volume decreased, and the decline was not accompanied by high-volume selling, suggesting profit-taking rather than panic selling.
Technical Outlook for Next Week: Three Scenario Analysis—Base Scenario (Highest Probability): Range-bound trading between 8990 and 9085. Holding above the 50-day moving average, the price will fluctuate within this range, awaiting fundamental data to determine direction. A strategy of buying low and selling high is recommended. Stronger Scenario: A firm hold above 9085, testing the 9120-9150 range, and potentially challenging the historical high of 9296. Weaker Scenario: A decisive break below 8990 and a close below this level, testing 8900; a break below 8820 with significant volume would signal a mid-term correction. Indicator Expectations: RSI remains neutral, MACD continues to flatten, and a sharp one-sided rise or fall is unlikely in the short term; a range-bound market is expected.
Trading Strategies (Short-Term Perspective)
Short-Term Trading (Intraday - 3-5 Days)
1. Buy on Dips: Buy on dips near 8990-9005 if it stabilizes and closes positive; place a stop-loss below 8970; first target 9075, second target 9120.
2. Sell on Rallies: Sell on rallies near 9075-9085 if it encounters resistance; place a stop-loss above 9110; first target 9010, then 8990-8900 if it breaks below.
3. Observation Conditions: If the price is stuck in the 9020-9060 range, do not open aggressive positions; wait for a breakout confirmation.
Key Risk Warnings:
1. Macroeconomic Event Risks: Australian inflation, China's August economic data, US non-farm payrolls, and fluctuations in US Treasury yields will directly impact commodities and the Australian dollar, causing the ASX200 to gap down; rising expectations of an RBA rate hike will suppress the financial and real estate sectors.
2. Sector Risks: Resource stocks are highly correlated with international commodity prices; consumer and REITs are highly sensitive to US and Australian bond yields, and rising yields will continue to suppress valuations.
3. Technical Breakdown Risks: A weekly close below 8990 (50-day moving average) indicates a weakening short-term trend; a break below 8820 with significant volume would destroy the medium-term bullish logic and amplify the potential for correction.
Dow Jones Industrial Average
Basic Market Overview:
US stocks opened the week under pressure but subsequently rebounded strongly. Major indices showed divergent performances at the close but generally returned to the 21-day moving average. The Dow Jones Industrial Average (DJIA) fell slightly for the week, while the S&P 500 and Nasdaq Composite saw modest gains. The Russell 2000, a small-cap index, briefly dipped below its 50-day moving average before recovering its weekly losses. Meanwhile, oil prices surged, and yields on 10-year and 2-year U.S. Treasury bonds rose to 19-month highs. Software, cryptocurrency, agriculture, and energy sectors led the gains, while AI hardware stocks showed mixed performance, with Dell Technologies (DELL) and Nvidia (NVDA) showing a bullish trend.
Overall, last week's market saw a "fall followed by a rise" recovery, driven by strong employment data, rising interest rate expectations, and a flurry of AI-related earnings reports. With U.S. Treasury yields climbing to relatively high levels, oil prices strengthening, and the probability of interest rate hikes increasing, investors may continue to trade around inflation, employment, and earnings realization in tech stocks in the short term.
Sector Performance:
Potential Leading Sectors (Industries Corresponding to the 30 Dow Jones Industrial Average Components)
1. Information Technology (Microsoft MSFT): Driven by AI computing power and the commercialization of enterprise Copilot; if US Treasury yields continue to decline, high-valuation growth blue-chip stocks will outperform; funds are buying back previously closed-end positions on dips.
2. Large Financials (Goldman Sachs, JPMorgan Chase): Driven by a widening yield curve benefiting bank net interest margins; expectations of M&A and large IPO transactions; the market is betting that the Fed will keep interest rates unchanged in September, and value financial blue-chip stocks possess both defensive and resilient attributes, with a very high weighting in the Dow Jones and Nasdaq.
3. Industrial Capital Goods (Caterpillar CAT): Driven by expectations of global infrastructure capital expenditure; stabilization of commodities; funds rotating from high-flying technology stocks to undervalued cyclical blue-chip stocks.
Sectors Facing Weakness/Pressure Risks:
1. Consumer Staples/Traditional Defensive Consumer Goods (Coca-Cola KO, P&G PG): Scenario: If market risk appetite recovers, funds will flow out of low-volatility defensive sectors and into growth and value cyclical stocks; rising oil prices will squeeze consumer profits.
2. Healthcare (Johnson & Johnson JNJ, UnitedHealth Group UNH): Short-term pressures: Profit-taking at high levels; if inflation data exceeds expectations and pushes up US Treasury yields, low-growth defensive sectors will underperform the market; uncertainty surrounding healthcare policies will suppress valuations.
3. Energy (Chevron CVX, ExxonMobil XOM): Divergence risk: If oil prices surge and then fall back, the energy sector will experience a short-term correction; the Middle East situation is volatile and not a stable bullish trend.
Technical Analysis:
The weekly chart remains within a medium-term upward channel, with no significant breakout last week. The market has shifted from a one-sided upward trend to a high-level consolidation phase, with the key support zone of 52700-52800 repeatedly finding support and acting as a short-term bullish defense zone. Resistance is concentrated at 53600-53750, with multiple attempts to break through failing to hold, indicating weakening bullish momentum. The short-term RSI has fallen from a high level to the neutral zone, and the MACD histogram is narrowing, suggesting slowing upward momentum and no clear reversal signal to the downside. The weekly candlestick closed as a doji, indicating intensified battle between bulls and bears, awaiting key data releases to determine the direction. Market characteristics: Increased intraday volatility, significantly influenced by US Treasury yields and Middle East geopolitical sentiment; divergent rotation among heavyweight stocks, with financial and industrial sectors showing resilience, while growth stocks experienced greater volatility.
Technical Outlook for Next Week: Three Scenario Predictions—Base Scenario (High-Level Consolidation with a Slightly Bullish Bias): Price holds above 52800, consolidating within the 53000-53750 range; awaiting the CPI data release before attempting to break above 54200. The medium-term uptrend remains intact. Optimistic Breakout Scenario: A strong break above 53750 with significant volume indicates a renewed bullish trend, targeting 54200-54700. Weakening Correction Scenario: A decisive break below 52650 (daily close below) signals a short-term correction, testing support around 52000. With a dense data release schedule next week, strictly control your position size. If the index continues to consolidate within a narrow range of 53200-53600, do not rush to open positions; wait for the CPI data on September 11th to break out of the range before trading in the direction of the trend.
Trading Strategies:
Operating Strategies (Short-Term Perspective)
1. Bullish Strategy (Buy on Dips)
• Buy on dips if the price retraces to 53100-53250 and finds support; stop-loss below 52800; first take-profit at 53650, with a further target of 54200 if it breaks through.
• Extreme pullbacks to the strong support zone of 52700-52800 present a better entry point for bullish positions.
2. Bearish Strategy (Sell on Resistance)
• Sell on rallies to 53600-53750 if the price encounters resistance and falls back; stop-loss above 53850; first target at 53200, with a further target of 52800 if it breaks below.
Key Risk Warnings:
1. Key Macroeconomic Events (Source of Greatest Volatility): September 11th: US August CPI inflation data, directly pricing in the Fed's September interest rate hike expectations; higher-than-expected inflation will push up US Treasury yields and suppress US stock valuations; a decline in inflation will benefit risk assets' rebound.
2. Geopolitical Risk Premium: The ongoing Middle East situation repeatedly disrupts oil prices and risk aversion; sudden news can cause instantaneous gaps in the index.
3. Seasonal and Funding: Historically, US stocks have been weak in September, and profit-taking pressure at high levels persists.
4. Technical Risks: If the support levels of 52800 and 52650 are breached consecutively, the medium-term bullish trend will be threatened.
Disclaimer: The information contained herein (1) is proprietary to BCR and/or its content providers; (2) may not be copied or distributed; (3) is not warranted to be accurate, complete or timely; and, (4) does not constitute advice or a recommendation by BCR or its content providers in respect of the investment in financial instruments. Neither BCR or its content providers are responsible for any damages or losses arising from any use of this information. Past performance is no guarantee of future results.
Lebih Liputan





2026 © - All Rights Reserved by BCR Co Pty Ltd
Pendedahan Risiko:Instrumen derivatif diniagakan di luar bursa dengan margin, yang bermakna ia membawa tahap risiko yang tinggi dan terdapat kemungkinan anda boleh kehilangan seluruh pelaburan anda. Produk-produk ini tidak sesuai untuk semua pelabur. Pastikan anda memahami sepenuhnya risiko dan pertimbangkan dengan teliti keadaan kewangan dan pengalaman dagangan anda sebelum berdagang. Cari nasihat kewangan bebas jika perlu sebelum membuka akaun dengan BCR.
BCR Co Pty Ltd (No. Syarikat 1975046) ialah syarikat yang diperbadankan di bawah undang-undang British Virgin Islands, dengan pejabat berdaftar di Trident Chambers, Wickham’s Cay 1, Road Town, Tortola, British Virgin Islands, dan dilesenkan serta dikawal selia oleh Suruhanjaya Perkhidmatan Kewangan British Virgin Islands di bawah Lesen No. SIBA/L/19/1122.
Open Bridge Limited (No. Syarikat 16701394) ialah syarikat yang diperbadankan di bawah Akta Syarikat 2006 dan berdaftar di England dan Wales, dengan alamat berdaftar di Kemp House, 160 City Road, London, England, EC1V 2NX. Open Bridge Limited bertindak semata-mata sebagai pemproses pembayaran untuk BCR Co Pty Ltd dan tidak menyediakan sebarang perkhidmatan kewangan, perdagangan atau pelaburan bagi pihaknya. Peranan Open Bridge Limited adalah terhad kepada pemprosesan pembayaran.


 English
 简体中文
简体中文
 繁體中文
繁體中文
 Bahasa
Melayu
Bahasa
Melayu
 Tiếng
Việt
Tiếng
Việt
 ไทย
ไทย
 日本語
日本語
 한국어
한국어
 ភាសាខ្មែរ
 español